Hello there! You've reached the portfolio-ish site of Ben Leduc-Mills. This website captures some of my career from user research and service design, to interaction design, software engineering, rapid prototyping & digital fabrication, open source hardware, and of course, AI.
An Agentic Future SDLC “Golden Journey” Map

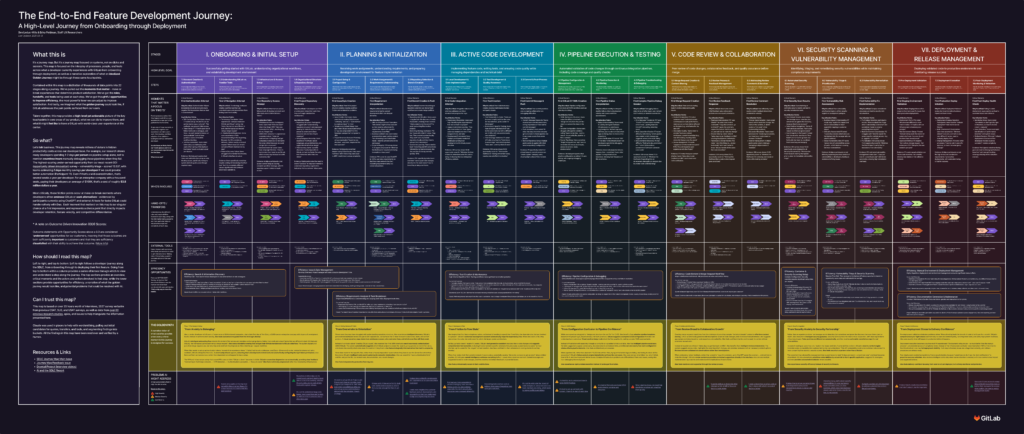
Mapping the real, systems-level work developers do with GitLab, from first day onboarding all the way through deploying features, while imagining a future ‘Golden Journey’, driven by AI and agentic workflows that could alleviate or eliminate the biggest pain points development teams face today.
Context & Contributions
GitLab is a single application that spans the whole DevSecOps lifecycle: Plan, Create, Verify, Package, Secure, Deploy, Monitor, Govern. Most of our research lived stage by stage, or feature by feature, though. Nobody had put together one end-to-end picture of what it actually feels like to move a piece of work from an idea through to a deployed, monitored feature, or where the friction really lives across that whole arc.
This journey map covers that gap. It’s not your typical click-through-screens kind of map, it’s focused on systems, processes, and the real work developers, DevOps, and SecOps practitioners do together, day to day.
I led this project, with another Staff researcher contributing throughout.
PROJECT DETAILS

ROLE: Lead Researcher
PROJECT TYPE: Foundational / Synthesis, Journey Mapping, Interviews
TEAM MEMBERS: 2
DURATION: ~3 Months
Problem
GitLab research was fragmented by stage. A team working on Verify had their own studies, a team working on Secure had theirs, and so on. That made it hard to see the moments that mattered most: the handoffs between roles, the tools people reached for outside GitLab, and the points in the journey where a bad experience could push a developer toward GitHub, ChatGPT, or some other alternative.
We needed one artifact that took the thousands of data points we’d already collected and turned them into a single narrative people could actually follow.
Hypotheses
We believed that if we could pull years of scattered research into one map, organized by the stages of the SDLC but built around the moments that matter rather than the tool itself, we’d give teams across GitLab a shared picture of where the biggest opportunities were, both for efficiency gains and for AI to help.
Methods & Process
Understanding
We started by reviewing everything we already knew: 65 GitLab research reports, 3,527 verbatim pulled from CSAT, SUS, and USAT surveys, and findings from over 60 previous research studies. On top of that, we conducted 17 90-minute interviews with developers, DevOps, and SecOps practitioners across SMB, mid-market, and enterprise accounts, walking through three journeys: onboarding, the feature creation process, and securing software with GitLab.
Refining
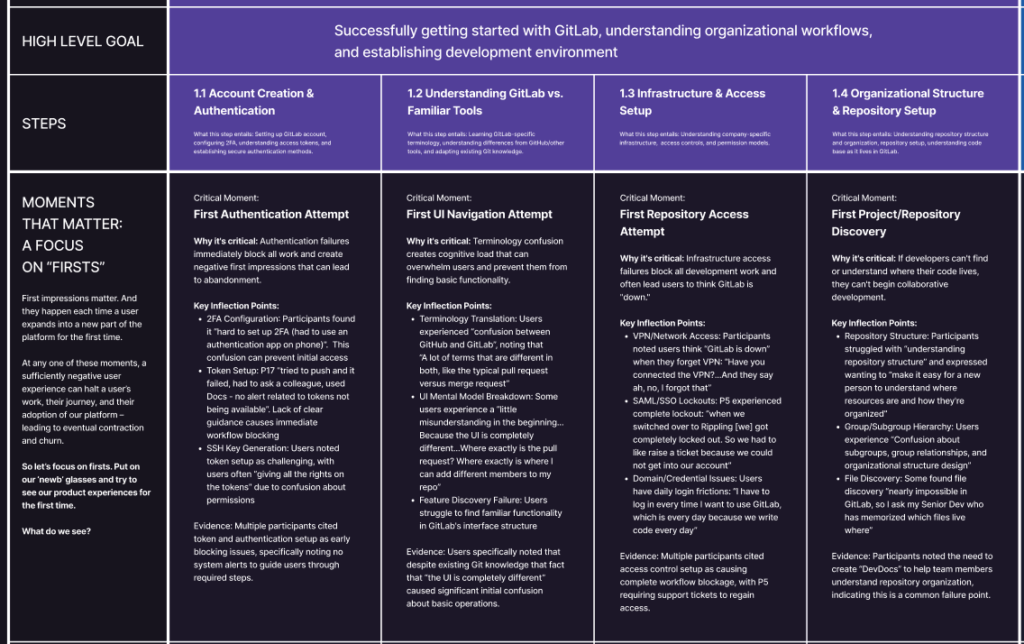
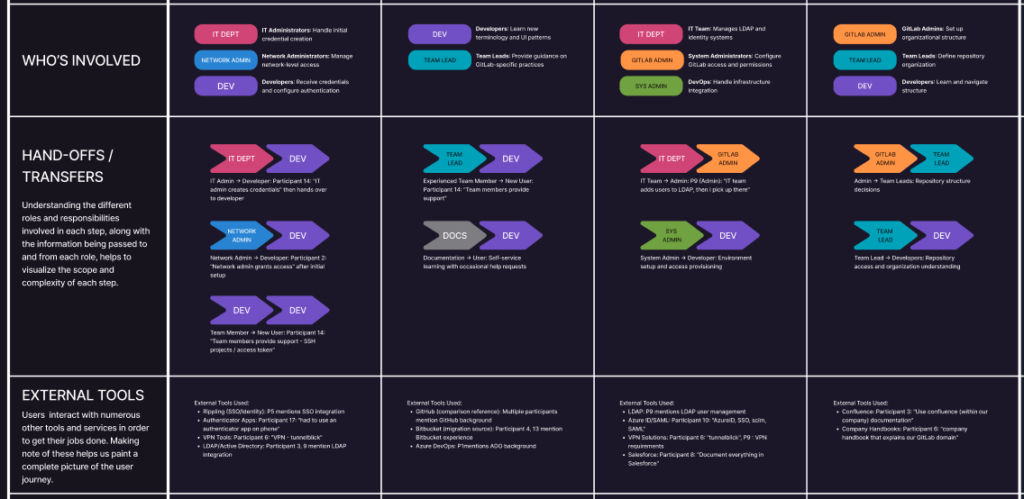
From all of that, something like 25 hours of interviews plus everything in the surveys and past reports, we pulled out the moments that matter. We organized the whole map into seven stages: Onboarding & Initial Setup, Planning & Initialization, Active Code Development, Pipeline Execution & Testing, Code Review & Collaboration, Security Scanning & Vulnerability Management, and Deployment & Release Management. Each stage breaks down into specific steps (for example, Onboarding covers account creation, understanding GitLab vs. familiar tools, infrastructure and access setup, and understanding org structure and repository setup), and for each step we documented the moment that matters most, why it’s critical, the key inflection points we saw in the data, who’s involved, what handoffs happen between roles, and what outside tools people reach for alongside GitLab.
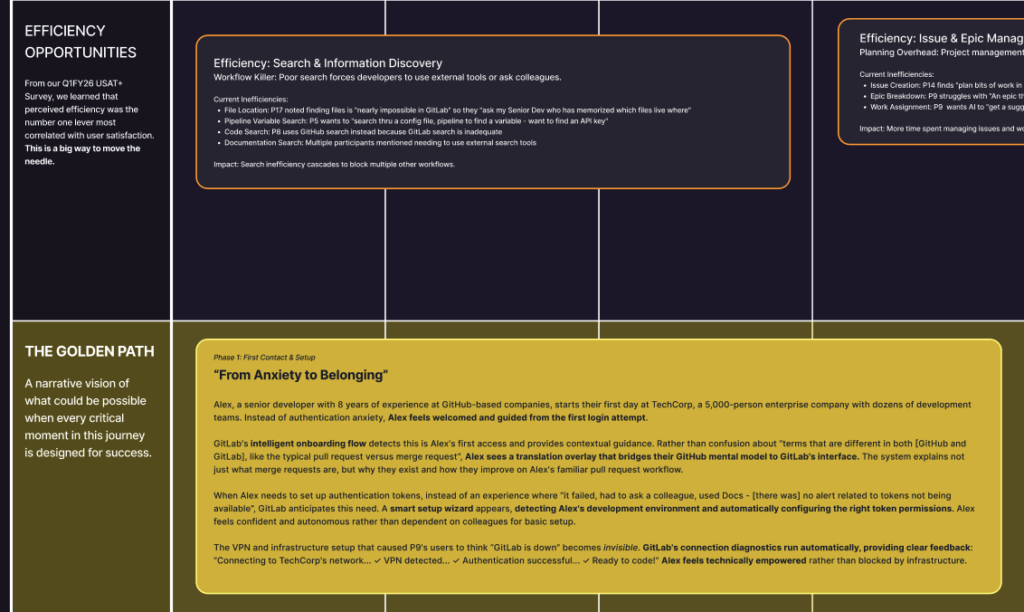
We also pulled in Outcome Driven Innovation data, flagging outcomes with high opportunity scores as needs GitLab isn’t yet meeting well enough. And for each stage, we called out specific efficiency opportunities, concrete, evidence-backed spots where the current experience is costing people time or causing friction.
Delivering
We put the whole thing in front of the org for feedback, sharing a 4-minute video walkthrough and asking teams across GitLab to look into the sections relevant to them and tell us what worked, what didn’t, and what questions they had. From there we refined the map into its current form. Each stage got its own “Golden Path” narrative, a short story of what the ideal version of that stage looks like when it’s working (things like “From Errors to Belonging” for Onboarding, or “From Friction to Flow State” for Active Code Development), along with a running list of problems AI might be able to help address.
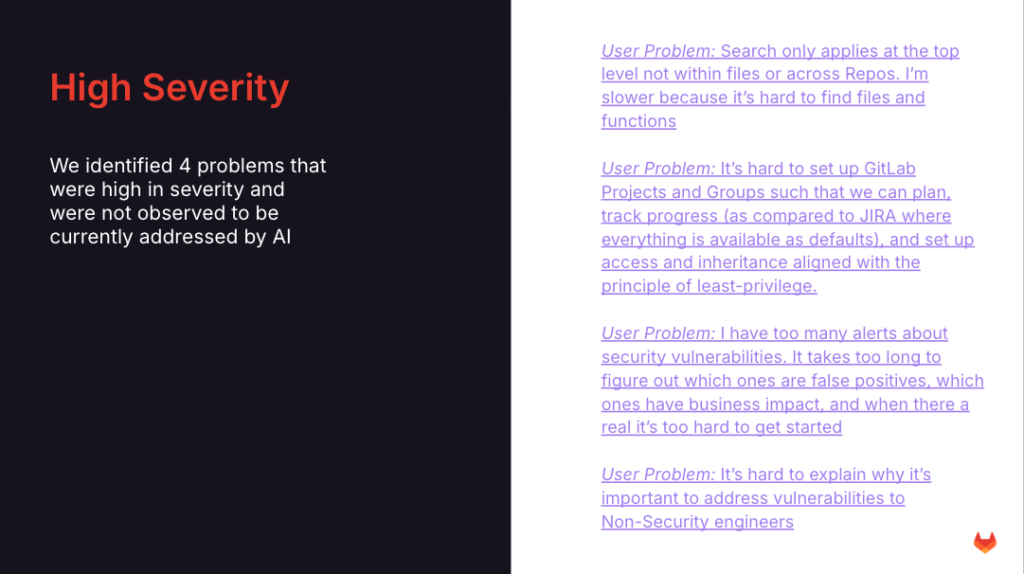
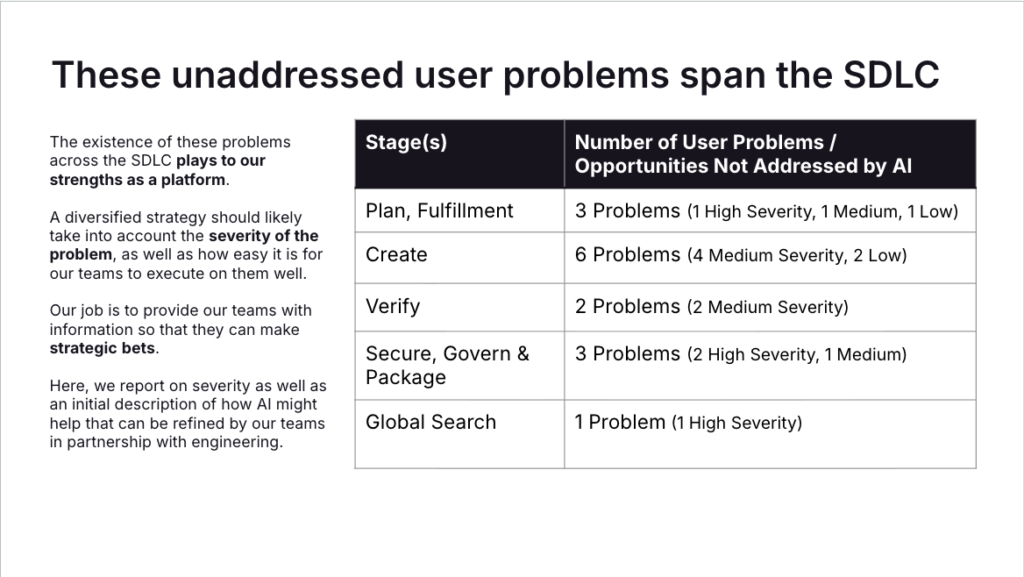
That second piece, the AI angle, became its own report. We took the friction points identified across the map and turned them into a standalone analysis called “AI Across the SDLC.” That report starts with the same research backbone as the map, then narrows in specifically on AI opportunity. We identified 21 user problems total. Six of those were problems people were already solving with AI on their own, mostly with agents, which told us something useful: these were validated needs, not speculative ones. The other 15 we sorted by severity, 4 high, 8 medium, 3 low, and for each one we laid out what kind of AI (agents, LLMs, or more traditional machine learning) seemed like the best fit, and why. We closed with a stage-by-stage view showing where in the SDLC each of these problems actually lives, since a few of them showed up in multiple stages at once, like the container scanning problem that touches both Verify/Package and Secure.
Findings & Results
The map put a real number on the cost of these problems. Based on an ODI survey, the highest-scoring opportunity alone was worth an estimated 2 months of savings per developer per year, which, conservatively, works out to something like $3.8 million a year for a thousand-seat enterprise customer.
The map also got used well beyond our team. It was printed out and brought to a design summit at the CEO’s house to help define what’s next for GitLab, including the pivot toward becoming AI-first. Teams across Growth, Customer Success, Customer Experience, Developer Experience, Design, and Product Management have all used it to inform their own decisions.