Hello there! You've reached the portfolio-ish site of Ben Leduc-Mills. I like using my background in computer science, HCI, and design to uncover answers to questions people didn't know they should be asking, and then crafting a data-driven, design-polished, narrative-rich artifact to tell the story.
Yes, I use AI everyday. For code, for design, and for research. No, I didn't use it for this website.
The Six Islands of Developer Experience
A meta-study to make three years of research understandable, important, and actionable
Context & Contributions
The main focus for this project was Autodesk’s cloud platform (Forge) and better understanding the body of research that had been done on the experience of developers using Forge.
My contributions to this project include conceptualizing the six islands framework, including the visual design and final interactive infographic, as well as the initial journey maps for all the islands, finding and matching the customer quotes and job stories, drafting the prioritization framework and hierarchy of needs, drafting the high-level recommendations and filling in the hypotheses and measures of success.
PROJECT DETAILS
ROLE: TEAM LEAD & LEAD RESEARCHER
PROJECT TYPE: META-STUDY
TEAM MEMBERS: 7
DURATION: 6 MONTHS
Problem
The research and design teams had done a significant amount of research regarding the developer portal, but much of the research knowledge was scattered throughout the organization with different teams.
Consequently, we were repeating a lot of work, asking the same questions and finding the same results over and over. No one had tried to look at the entire corpus of work, produce an easily comprehensible artifact, and communicate out to the organization.
Hypotheses
By performing a meta-study on the developer experience, we believed we could produce an artifact which was compelling enough to finally move the needle on a number of important initiatives which were currently impeding the developer experience, but were not being given the attention they deserved.
Methods & Process
Our process consisted of three main stages:
- Gather and review previous research on developer experience
- Synthesize the findings into a common form
- Extract the major touchpoints of the developer journey
- Create a visual framework for understanding (the six islands)
- Visualize each step of the developer experience using the framework
- Enrich the journey map with direct insights from customer research
- Distill our learnings from each island, prioritize areas of need
- Create strategic recommendations to address greatest weaknesses
- Draw out tactical implementations, hypotheses, and measures of success
- Plan an initial area of focus to implement our recommendations
Synthesize
Gather and review previous research on developer experience
One of the major drivers for this effort was the knowledge that our collective organization had a lot of existing research about the developer experience of our platform, yet the research was failing to move the platform in the right direction — not because of the quality of the research, but because the research insights were living in silos within teams scattered throughout the organization. So naturally, our first step was to gather and review every bit of research relating to the developer experience that we could get our hands on.
Synthesize the findings into a common form
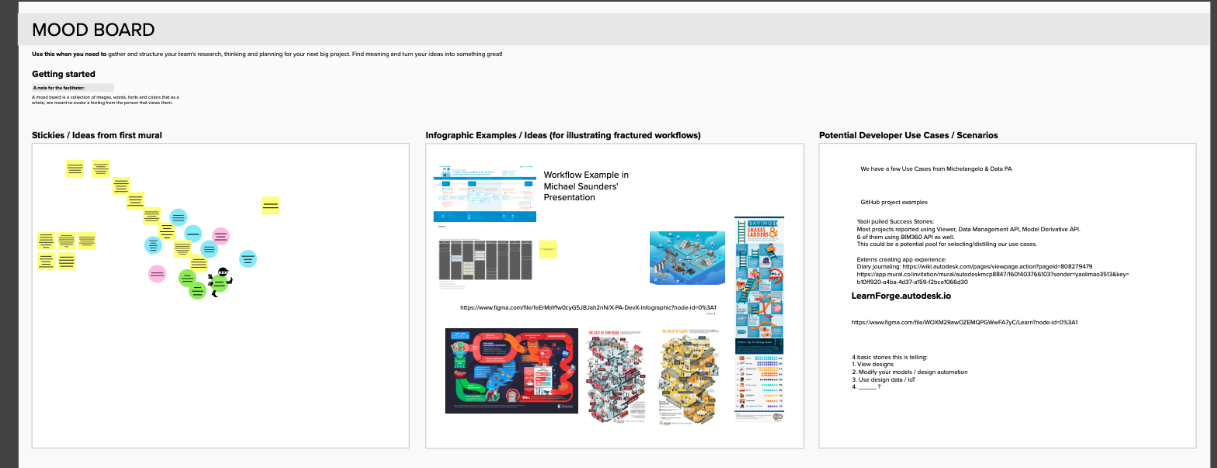
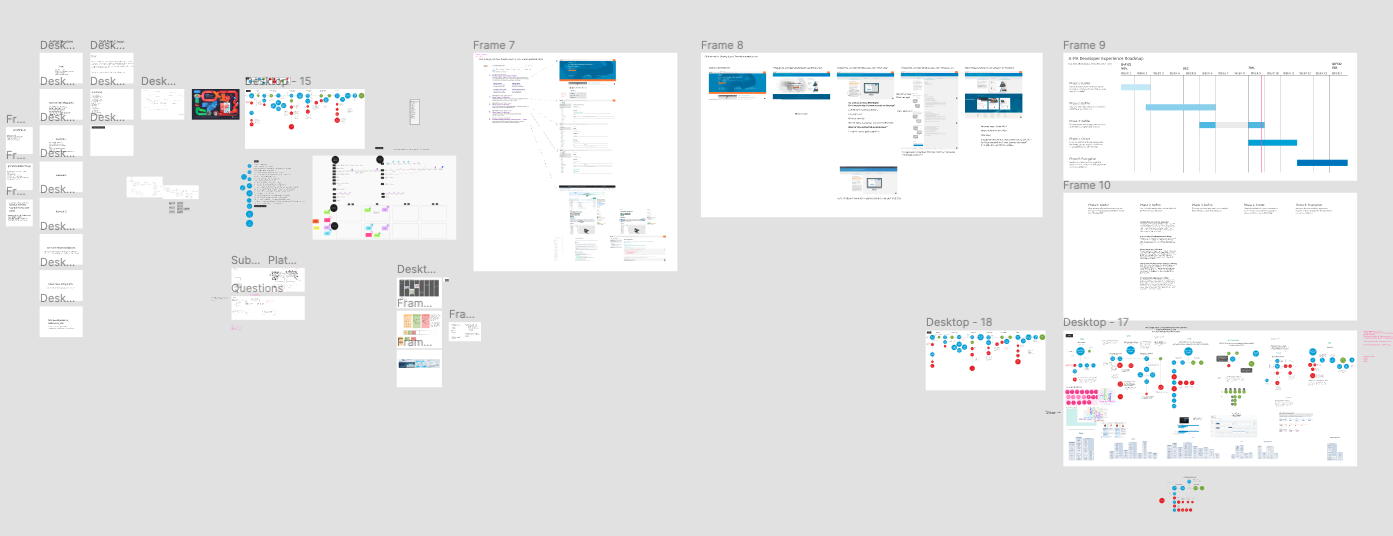
We used both Mural and Figma to help us organize our thoughts — some screenshots of our work-in-progress are below — we discussed what the general structure of our deliverable should be, what the ‘data types’ or ‘currency’ we were operating with, and how best to categorize previous research insights in a way that would allow us to present a cohesive point of view.
Visualize
Extract all the significant touchpoints of the developer journey
As we continued to cluster and organize the previous research findings, we were able to start mapping the precise steps our customers were taking.
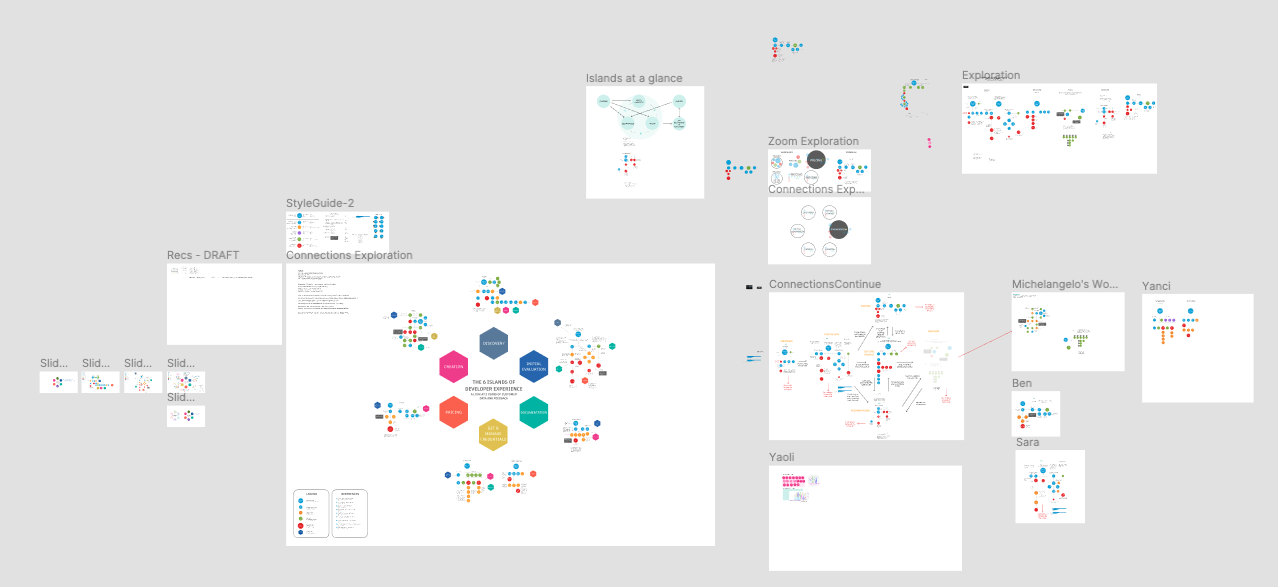
Create a visual framework for understanding
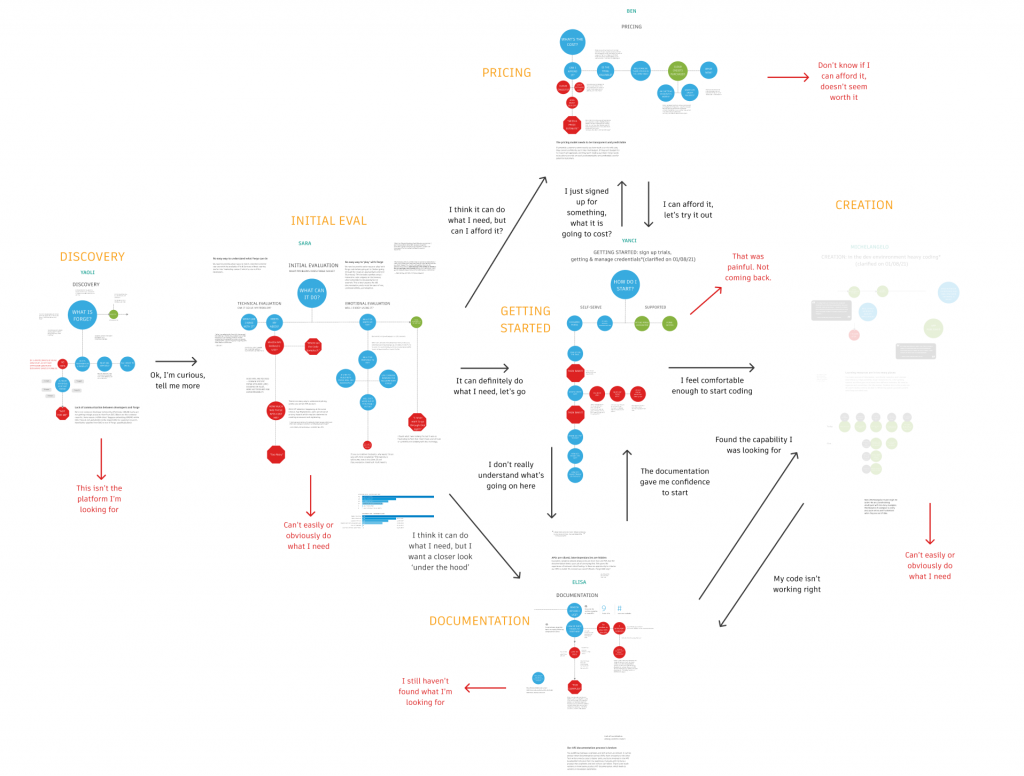
Our clustered journey maps became ‘islands’ of experiences – but as parts of the same overall experience, we needed to map the journeys between islands – what factors were causing movement amongst the islands?
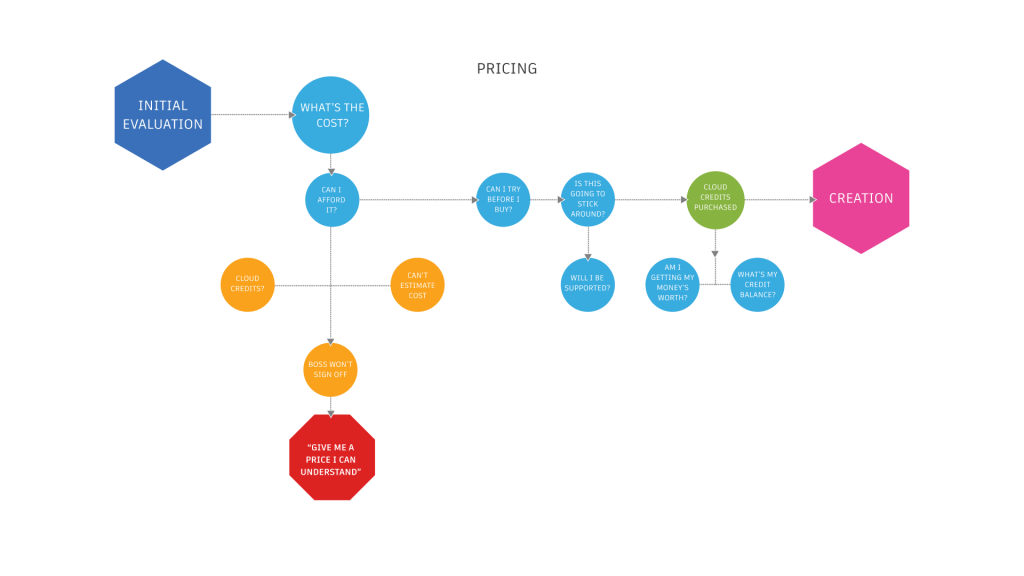
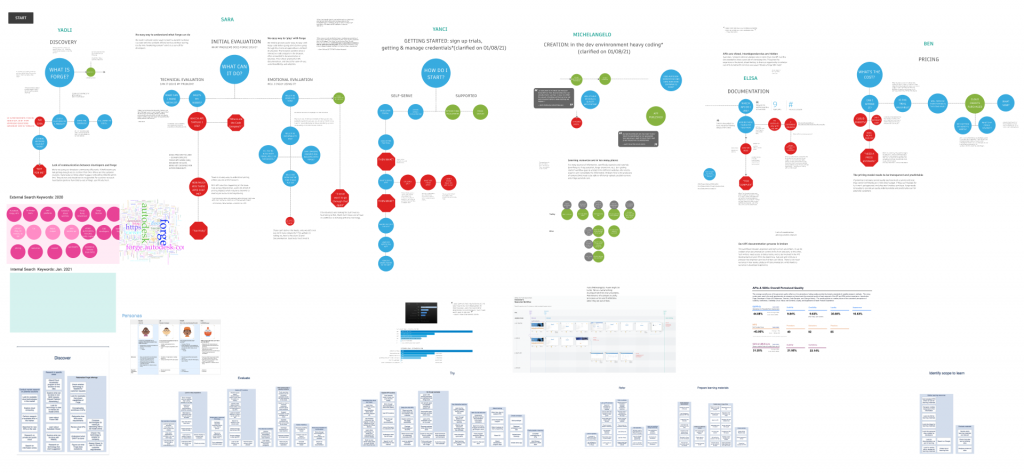
Visualize each step of the developer experience using the framework
For each of the six islands we defined, we iterated on defining the steps in the journey, the flows and branches within the island, as well as the bounds that led users away from our service and the connections to the other islands.
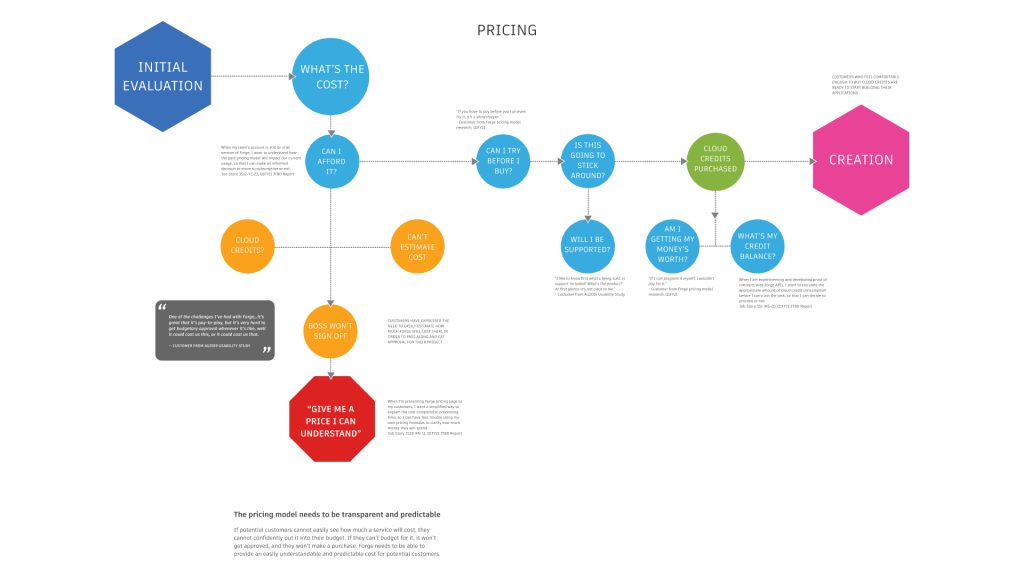
Enrich the journey map with direct insights from customer research
Finally, wherever possible we found direct evidence to place next to each journey step, such as customer quotes and job stories, research data and insights from our own analysis. We also pulled out hero quotes and summary statements communicating a few of our conclusions.
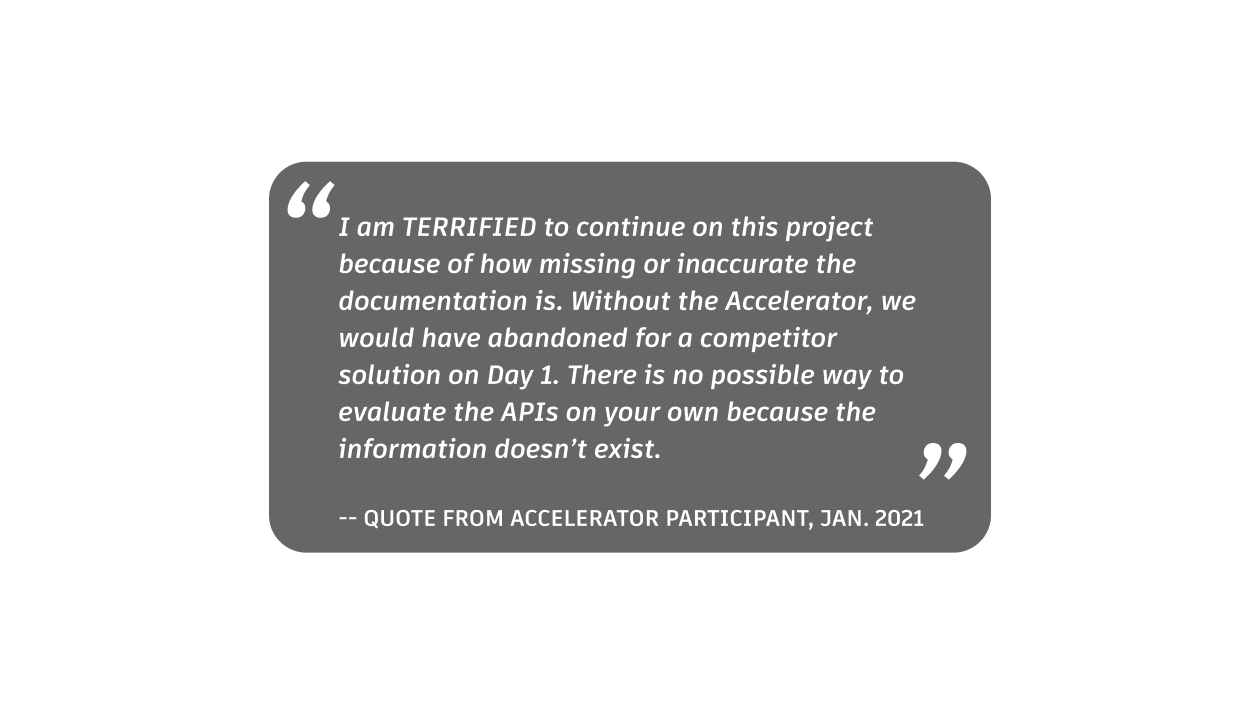
This quote is emblematic of the kinds of feedback we were encountering. We decided we couldn’t stop with just our current map. We had to form a plan to help improve the developer experience across our organization.
Strategize
Distill our learnings from each island, prioritize areas of need
After completing the initial map representing the current state of our developer experience, we moved towards thinking strategically about what changes should be made to address the numerous pain points we uncovered. We started by focusing in on the most problematic sub-section of each island, and extracting a simple customer problem and summary needs statement from that.
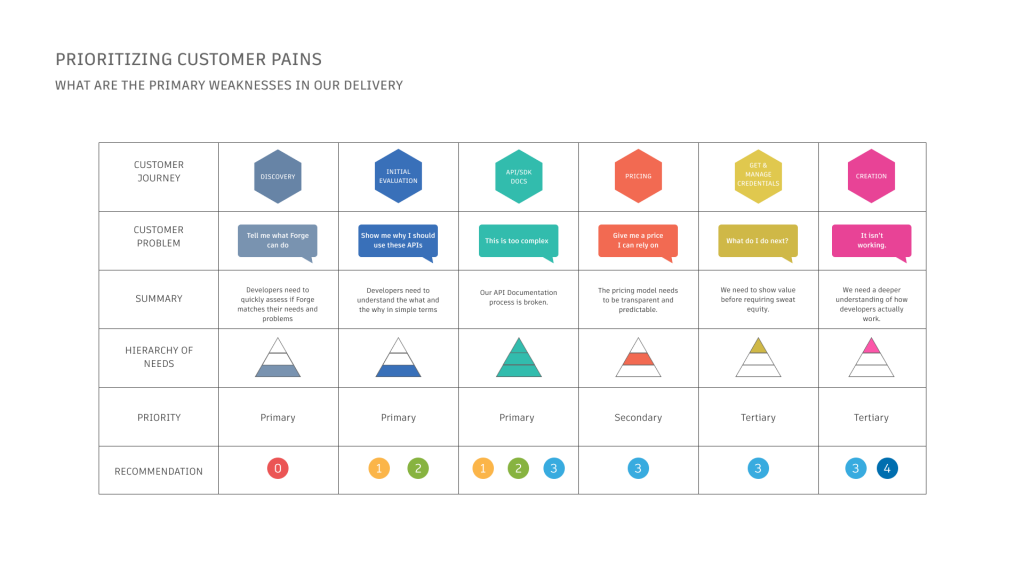
We then thought about the problem in terms of pervasiveness — how many of our developers were likely to encounter this particular problem — and mapped it onto a hierarchy of needs (a la Maslow). This gave us a way to think systematically about which areas to prioritize.
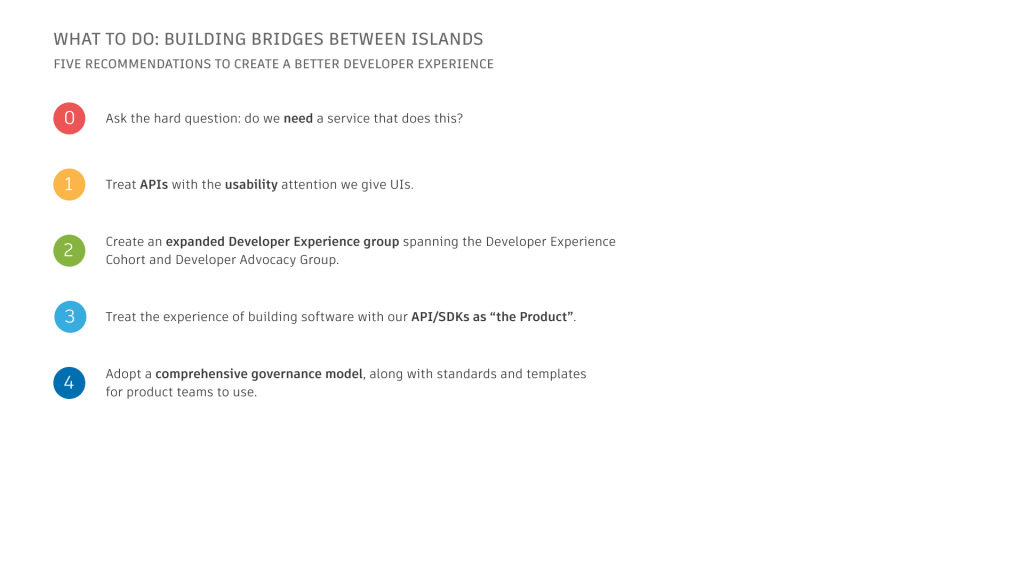
Create strategic recommendations to address greatest weaknesses
With our prioritized areas in mind combined with our research data, we drafted five recommendations we felt would address the majority of the issues we were aware of. We mapped these recommendations back to the prioritized needs to communicate where in the process certain needs should be addressed.
Draw out tactical implementations, hypotheses, and measures of success
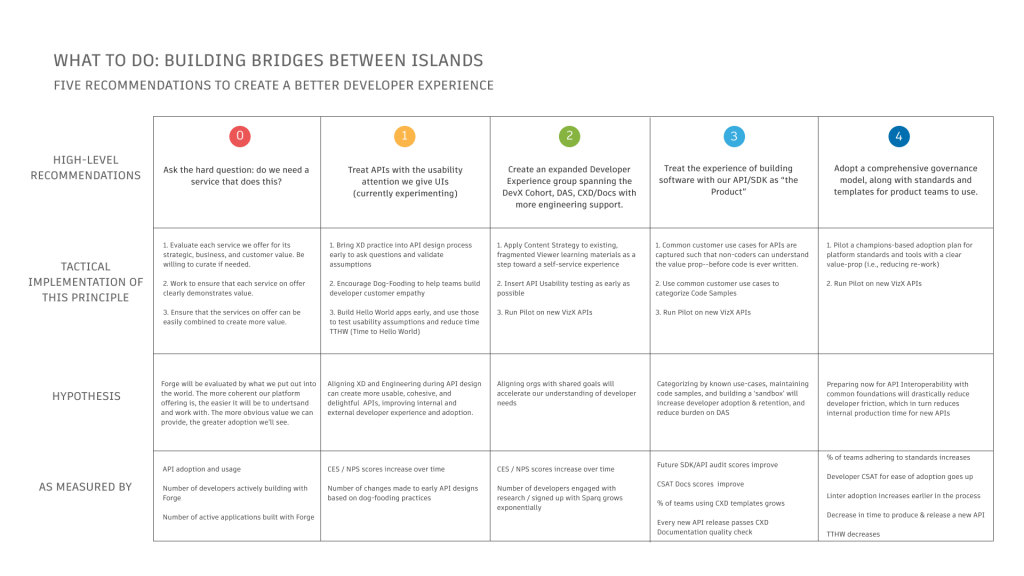
For each of our high-level recommendations, I drew out some examples of the recommendation in action — tactical implementations. We also stated our hypotheses about what would change if our recommendations were followed as well as how we ought to measure them.
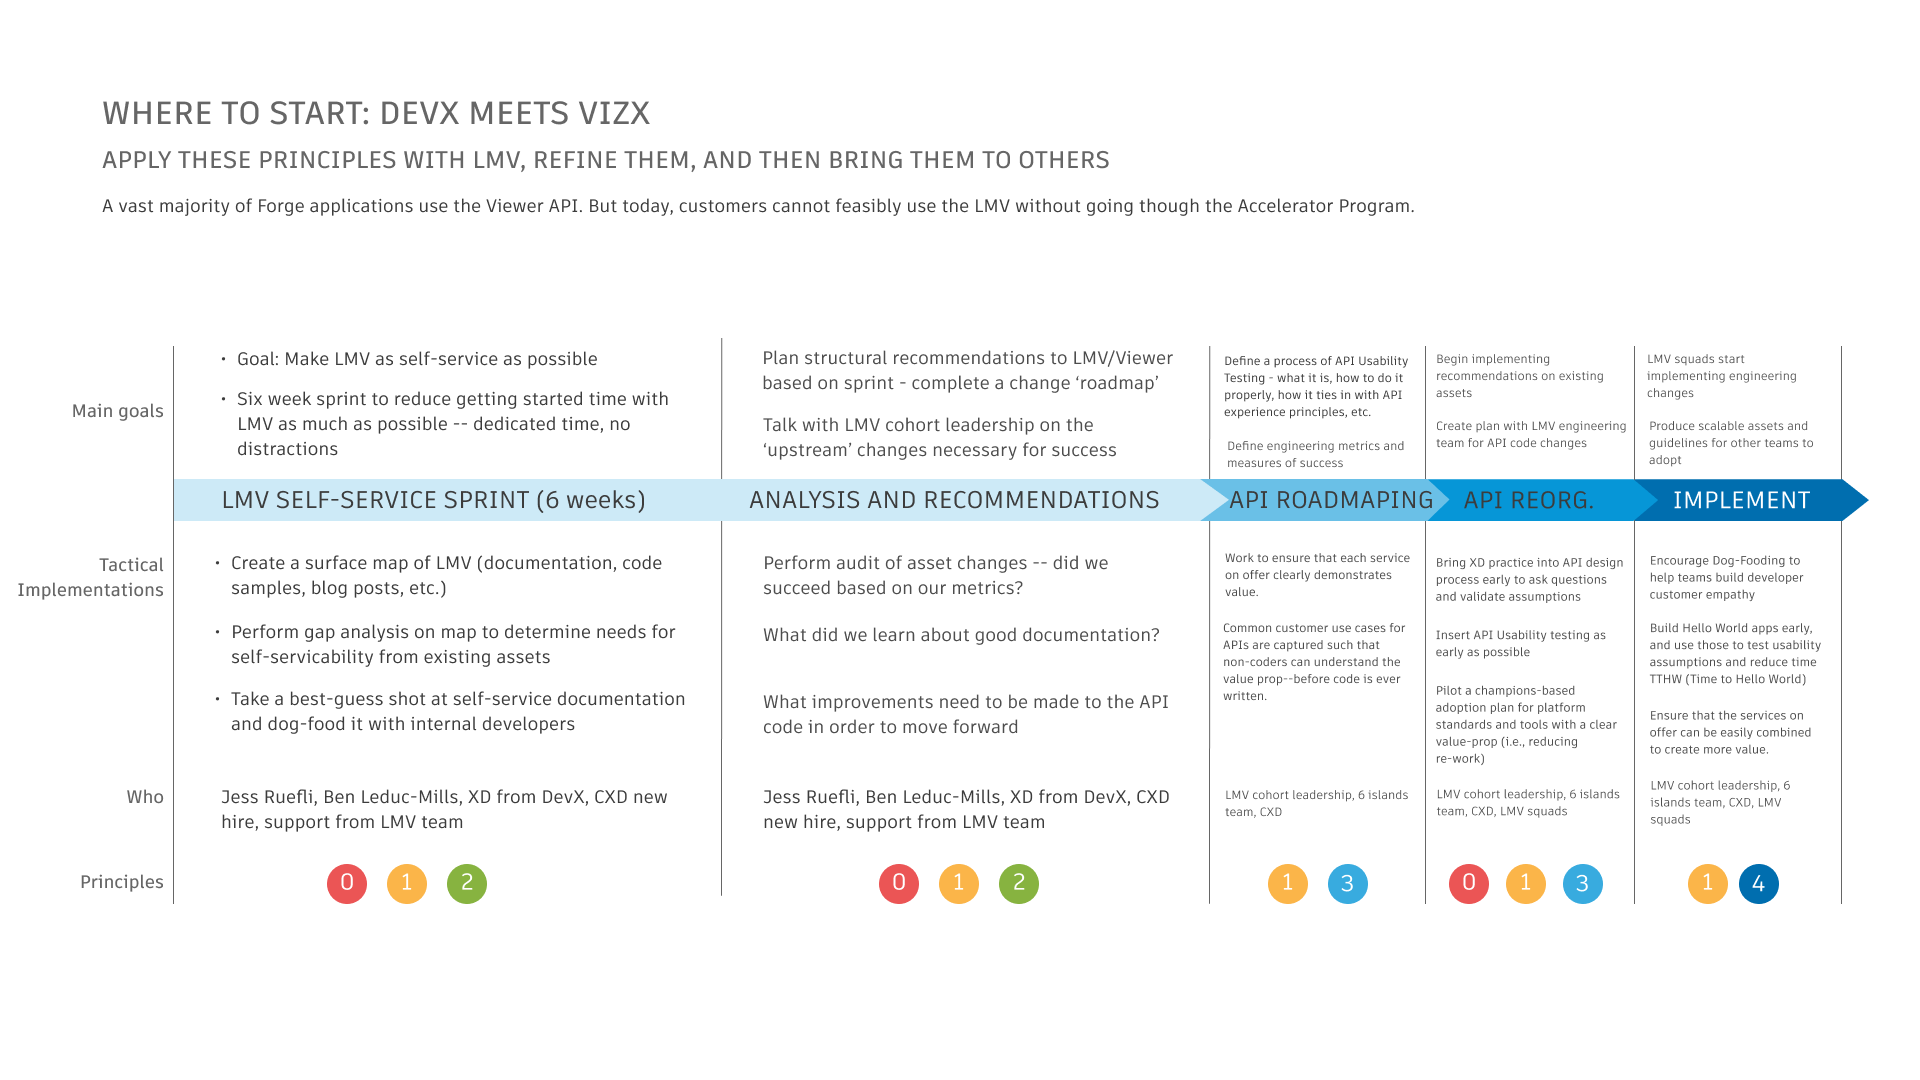
Plan an initial area of focus to implement our recommendations
From here it became clear that we needed a testing ground — a specific area where we could implement our recommendations, measure the results, and evaluate whether or not we were correct in our hypotheses. We put together a project roadmap with a particular team in mind, with the initial goal of dramatically improving the self-serviceability of their API’s documentation in a six-week sprint.
Findings & Results
We put together an interactive infographic in Figma with all of our island maps, analysis, recommendations, and roadmap as a means to have a living artifact for others to digest the work. (If you cannot access the infographic below, please contact me for access).
So far, the research has gained some momentum and been presented at both our company-wide research meetup and our larger discipline (UX, research, and PM) quarterly meeting. It has also been incorporated into how we tag and classify new research insights within our research database.
As of June 2021, we are planning the launch of our focused six-week sprint for next quarter, and the project has large organizational support and attention from higher level management. I will update this post as results from that project become available.