Hello there! You've reached the portfolio-ish site of Ben Leduc-Mills. I like using my background in computer science, HCI, and design to uncover answers to questions people didn't know they should be asking, and then crafting a data-driven, design-polished, narrative-rich artifact to tell the story.
Yes, I use AI everyday. For code, for design, and for research. No, I didn't use it for this website.
The 10-Step Customer Research Lifecycle
Defining the UX research process for Autodesk’s Cloud Platform group
Context & Contributions
I was the second member of a two-person research team when I joined Autodesk’s cloud platform group. Part of our charter was to build out the practice of research across the (~600 person) organization. Part of this effort involved defining what exactly our research process was, step-by-step.
While my manager and I discussed the steps broadly, the timeline, artifacts, tips, visual design, and content were delivered by myself.
PROJECT DETAILS
ROLE: LEAD RESEARCHER
PROJECT TYPE: PROCESS & PRACTICE
TEAM MEMBERS: 1
DURATION: 2 MONTHS
Problem
The research team was tiny, and the organizational awareness of who we were and what we did was minimal. We needed to define our process for ourselves and for our stakeholders. For ourselves, so that we could deliver a consistent style of research, and as our team grew, have an easy way to communicate the ways we worked. For our stakeholders, so they know what to expect when they engage in research with our team, and to give them a deeper understanding of the research process.
Hypotheses
Our hypothesis was that by solidifying our own process and producing a visual artifact for others, we would be able to not only deliver a more consistent and comprehensive research approach to our stakeholders, but that our stakeholder would be able to better understand our process and their role within it, thus leading to better research outcomes across the organization.
Methods & Process
The process was fairly straightforward, and can be broken down into:
- Examine our working patterns, draw on past experience and market analysis
- Brainstorm our views as to what the customer research process should be
- Refine the different steps and stages in the journey
- Create a visual framework for communicating the lifecycle
- Visualize each step of the lifecycle
- Enrich the lifecycle with additional information (e.g., deliverables/artifacts, tips and tricks)
- Present the artifact to some initial stakeholders
- Revise the lifecycle based on feedback
- Build supporting materials to scaffold the process (e.g., templates, wiki pages)
- Finalize the visual artifact and supporting documents and deliver them to stakeholders and new team members
Define
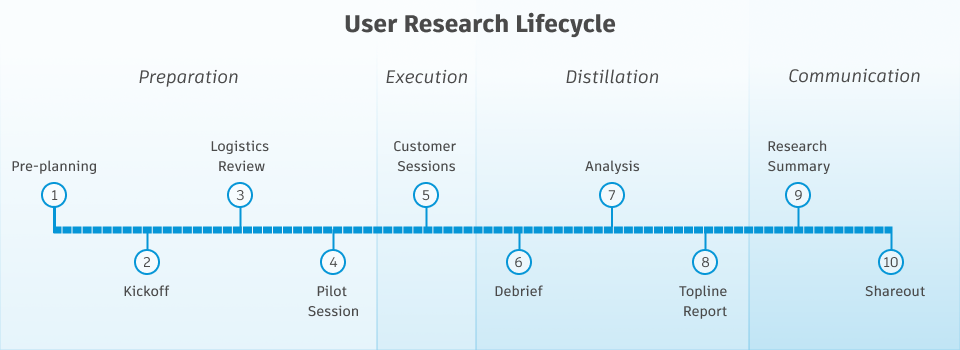
Drawing on our past experiences as researchers as well as some comparative analysis of other research practices, we broke down our process into ten discrete steps:
- Pre-planning
- Kickoff Meeting
- Logistics Review
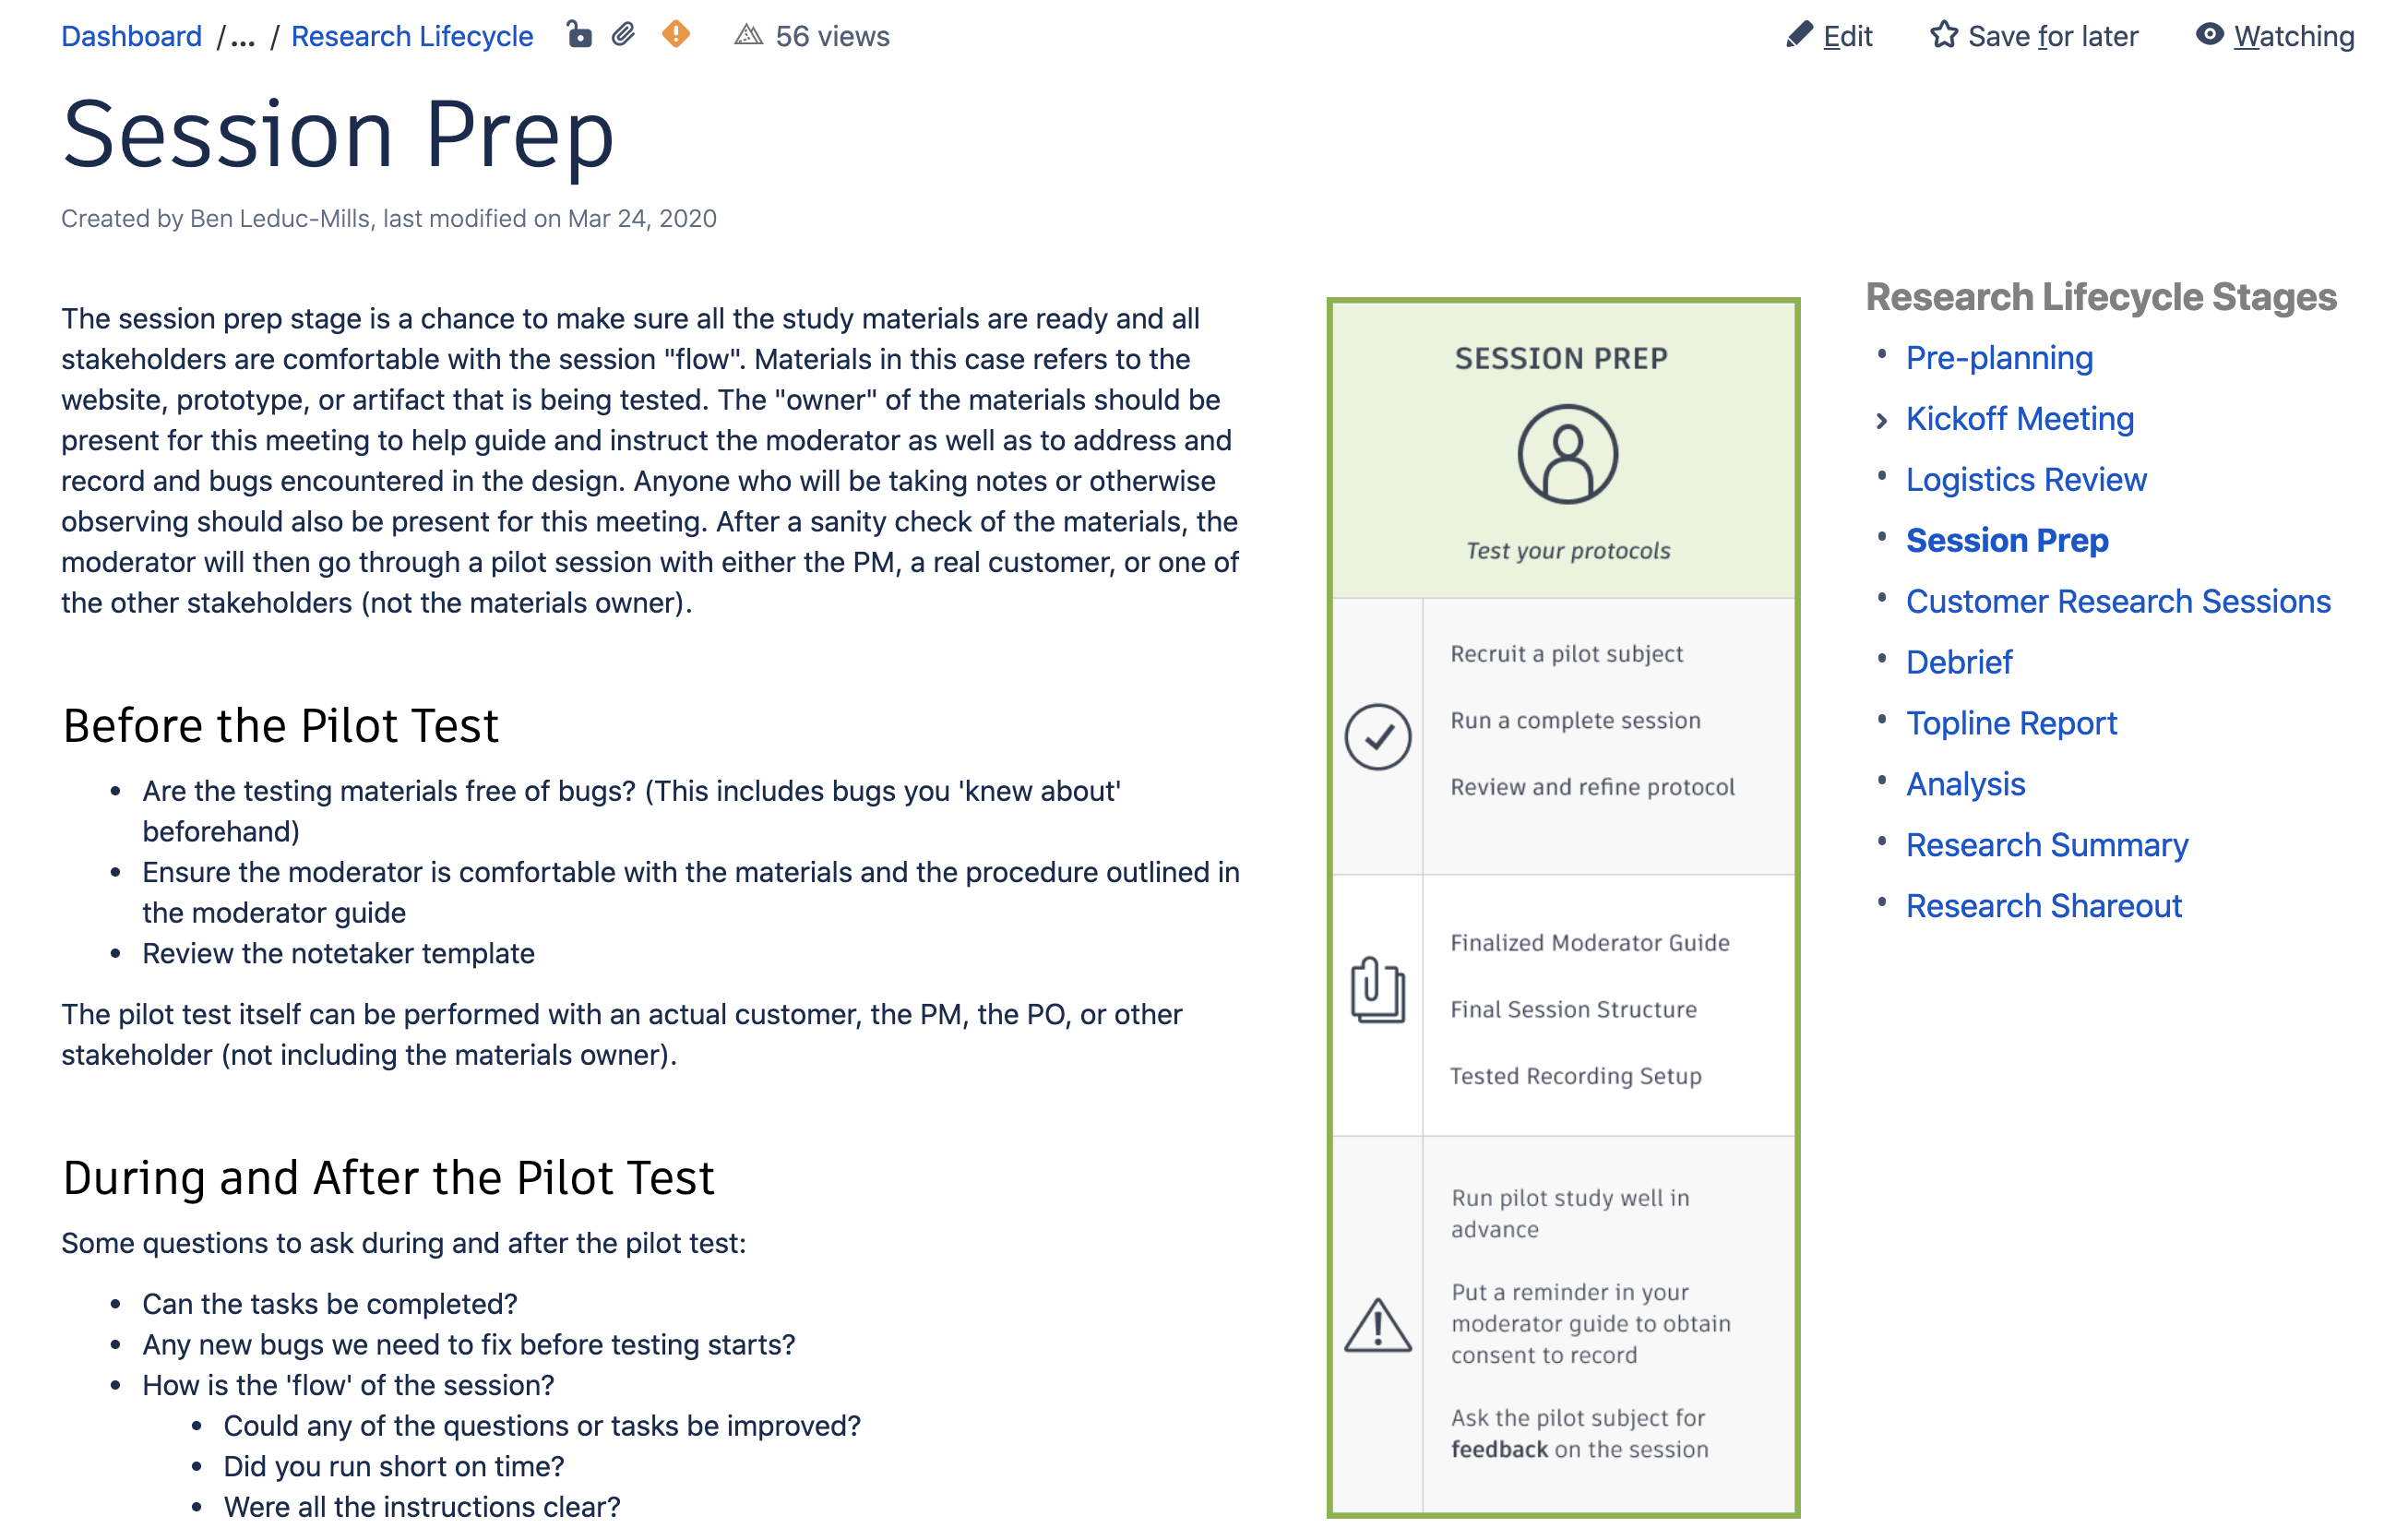
- Session Prep
- Customer Sessions
- Debrief
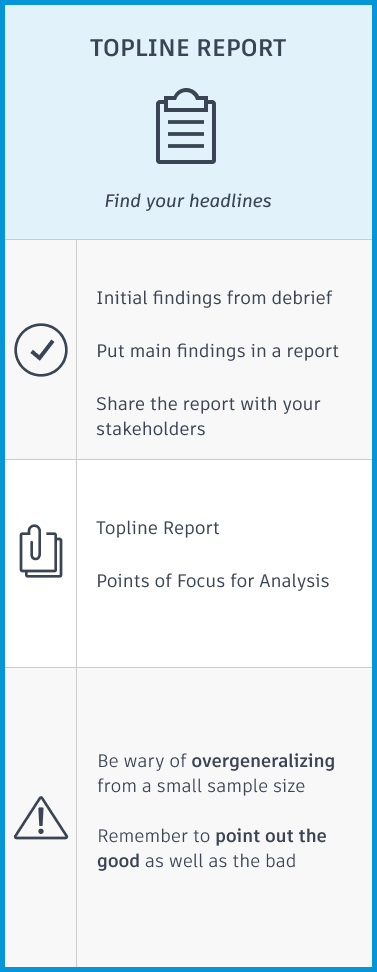
- Topline Report
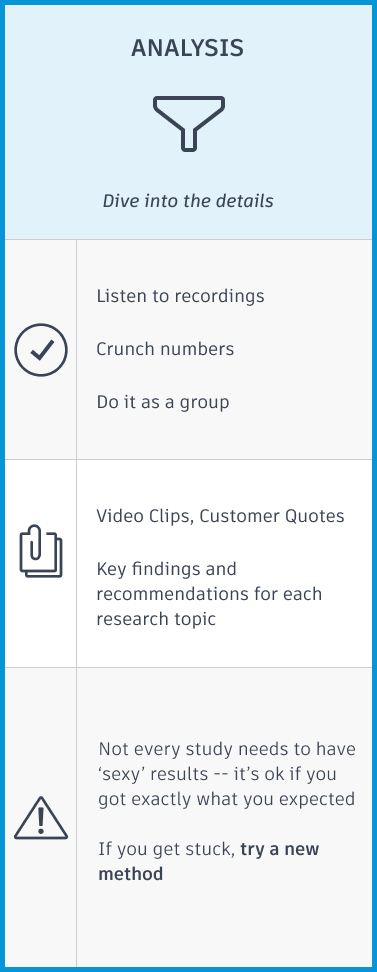
- Analysis
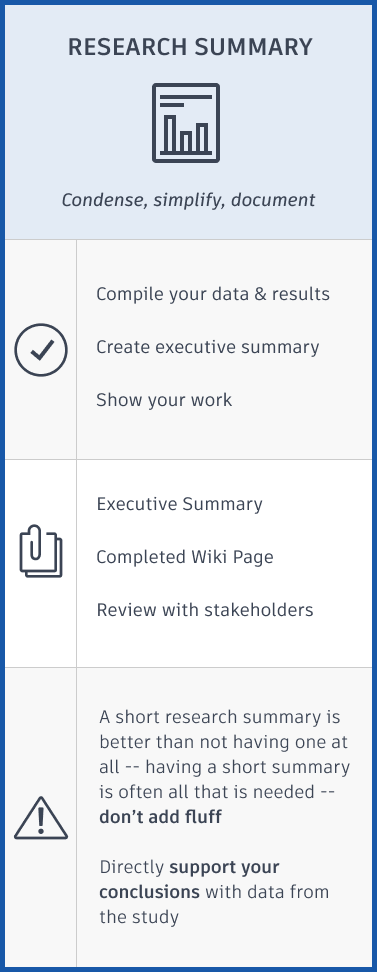
- Research Summary
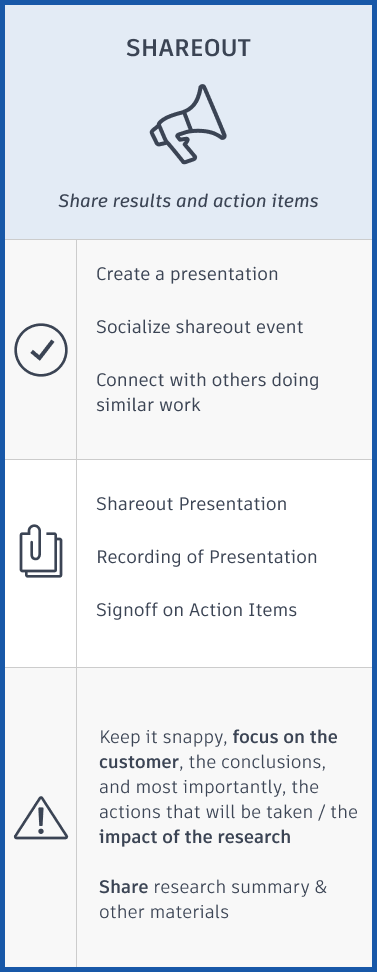
- Shareout
Iterate
Refine the different steps and stages in the journey
After defining the steps, I went to work iterating on what exactly each step meant. What happens during this step? What is the expected output? Who is involved? How do you know you’ve completed each step? What are some best practices and ‘gotchas’ relating to each step?
Create a visual framework for communicating the lifecycle
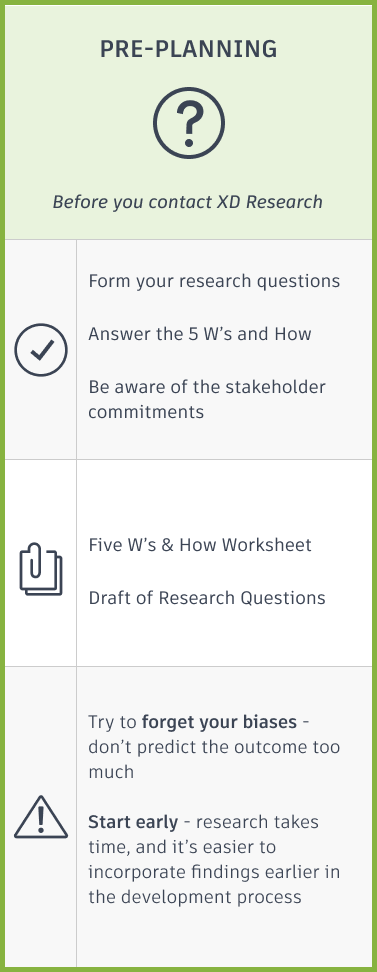
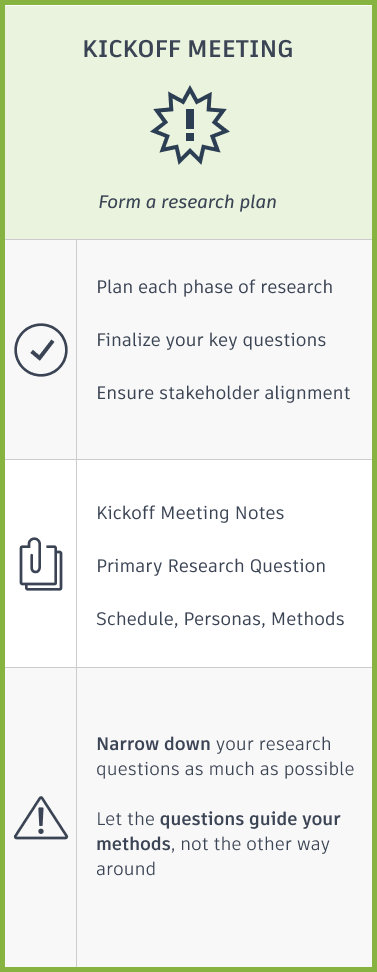
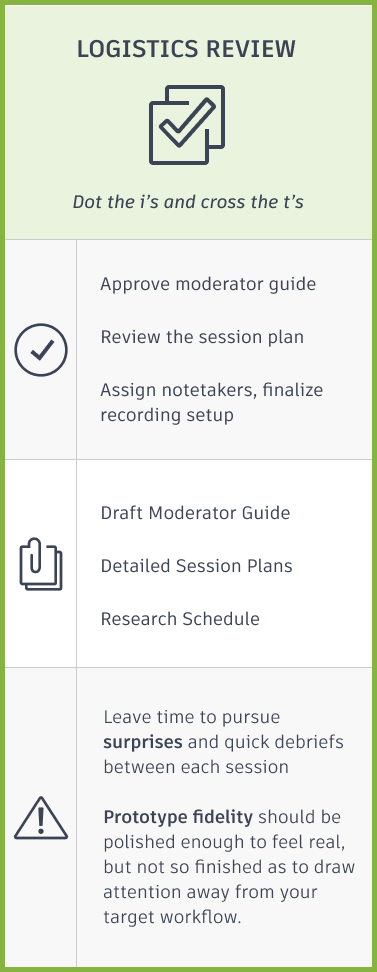
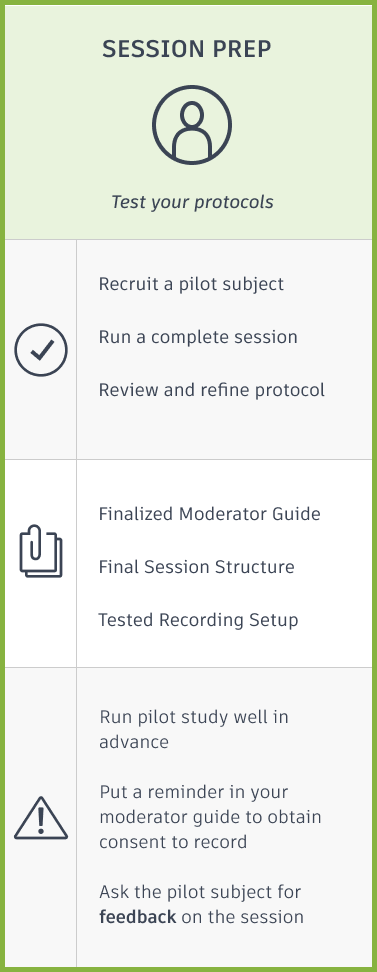
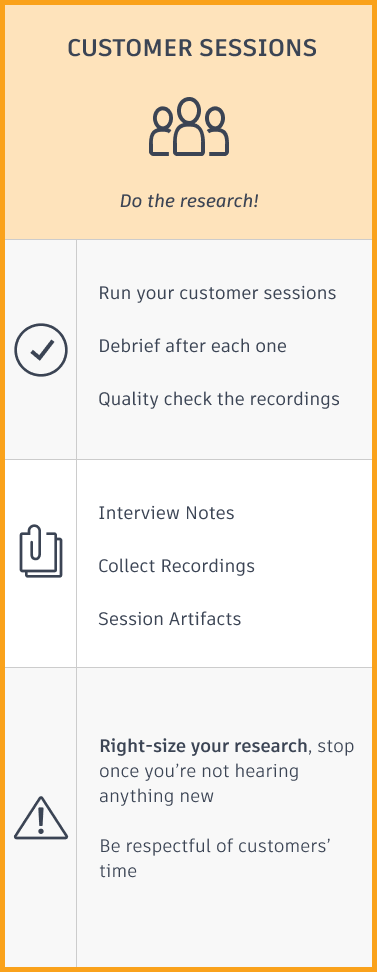
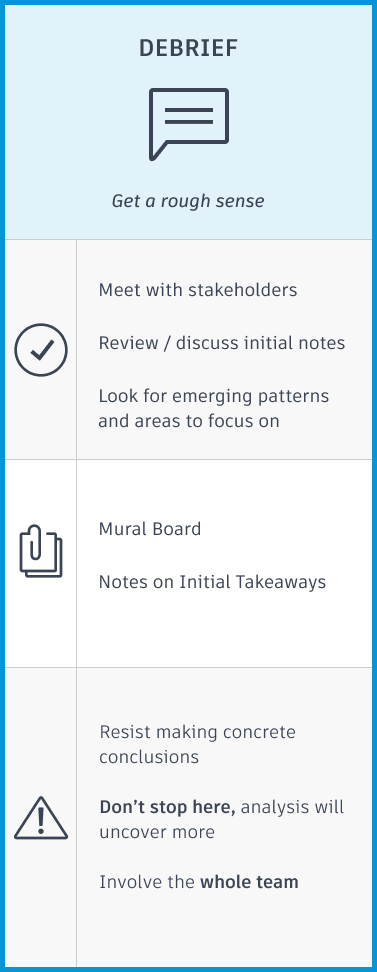
Using the more robust definitions of each step, I was able to create a visual scaffolding to help transform the list of steps we had into something that felt more like a process or a framework. For each step I included:
- The step name
- Tagline
- Actions (what happens at each stage)
- Deliverables (the artifacts / documents produced)
- Tips & Tricks (common mistakes & best practices)
I also realized that the 10 step process could be abstracted into four phases: preparation, execution, distillation, and communication. These four themes helped give the process a narrative, and provided a deeper level of meaning behind each step.
Visualize the lifecycle
For the visual design, I used simple iconography-style visuals and some color to indicate phase groupings, but mostly worked on refining the language for each piece of text to be as concise (yet descriptive) as possible. Through this process it became clear that I was essentially creating a reference guide, one that needed more supporting material to augment and enrich the content, since there was so much that couldn’t fit on a single visual.

Enrich the lifecycle with additional information
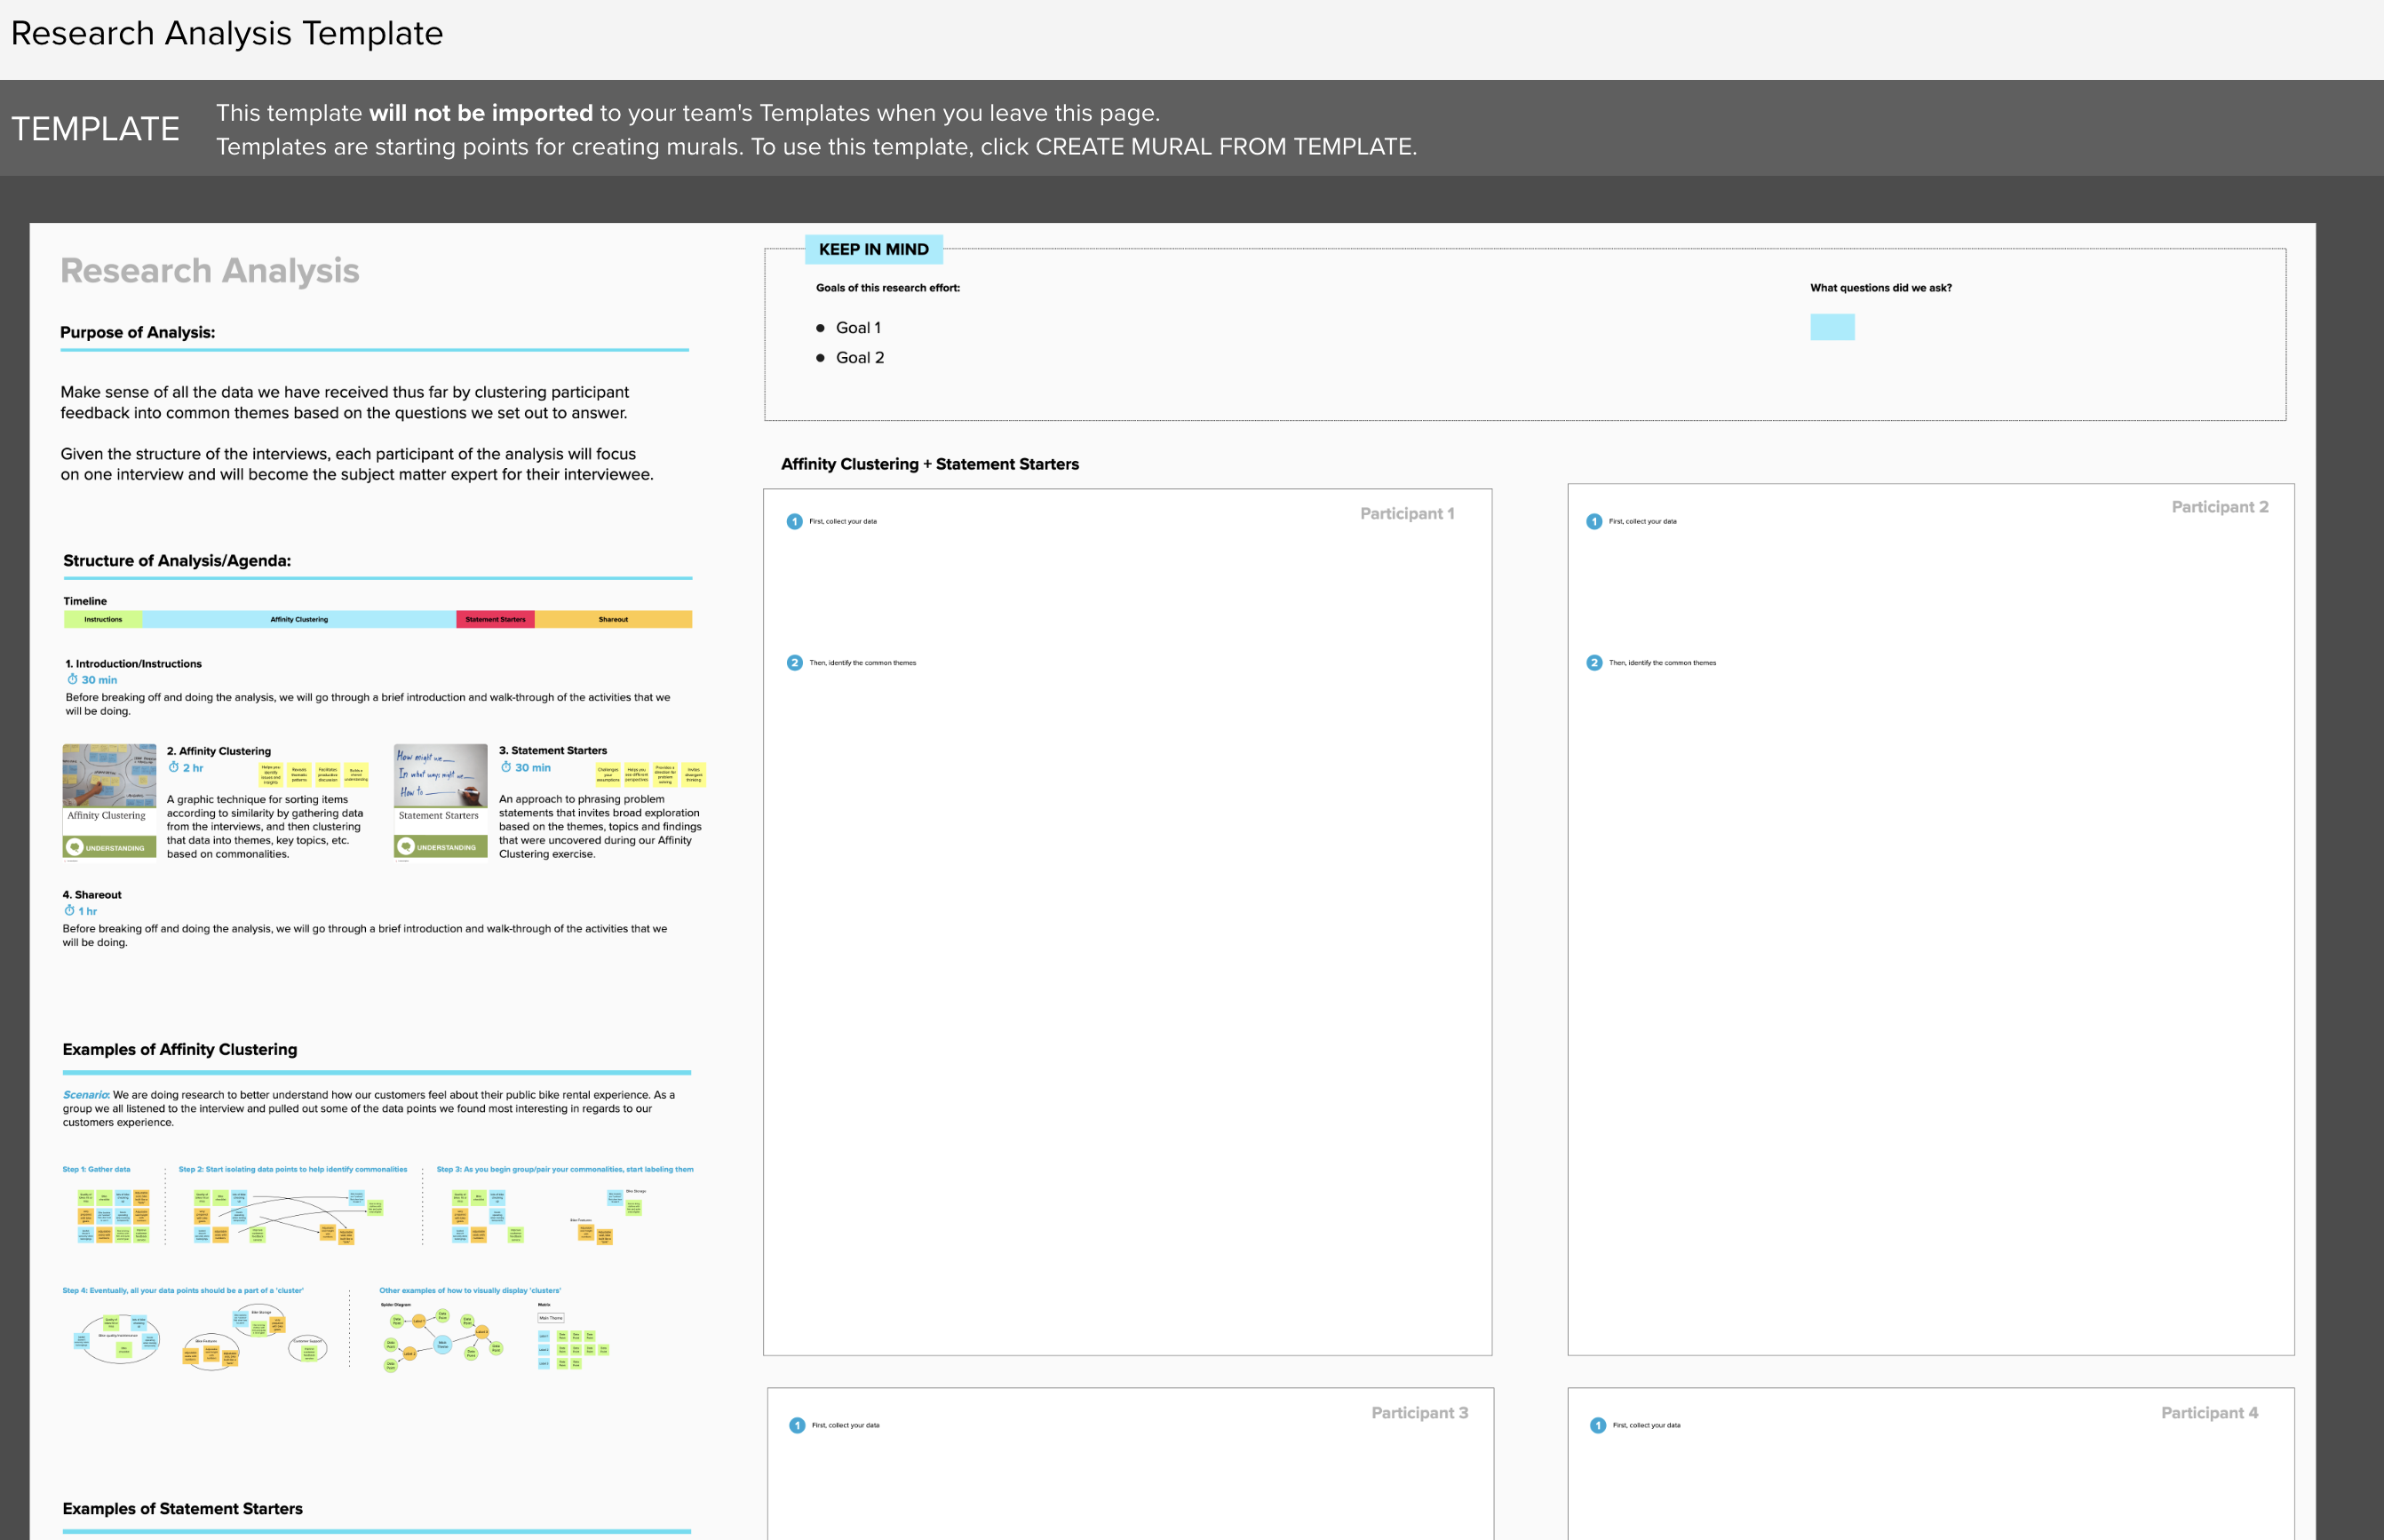
To support the visual reference, I created a wiki page for each of the steps, a main page explaining more about the process, and a series of templates and examples of the artifacts referenced in the lifecycle (e.g., kickoff meeting guide, moderator guide, sample debrief workshops, research summary templates, etc.)
Deliver
Build supporting materials to scaffold the process (e.g., templates, wiki pages)
After presenting the initial work to stakeholders and iterating based on their feedback, we were able to build out and deliver the final set of wiki pages, templates, guides, examples, and visual reference.
Findings & Results
This set of materials had been presented to our larger organization and to numerous stakeholders across our organization and across the company. It has also become part of how we onboard new members and interns to the research team – they are not only given a presentation of the lifecycle as part of their training, but are encouraged to contribute to it and to challenge it. The lifecycle is a key artifact in telling our story, and having new eyes on it frequently has kept it fresh and engaging.