Hello there! You've reached the portfolio-ish site of Ben Leduc-Mills. I like using my background in computer science, HCI, and design to uncover answers to questions people didn't know they should be asking, and then crafting a data-driven, design-polished, narrative-rich artifact to tell the story.
Yes, I use AI everyday. For code, for design, and for research. No, I didn't use it for this website.
Cloud Platform Analytics
Laying a robust groundwork for platform analytics across an entire organization
Context & Contributions
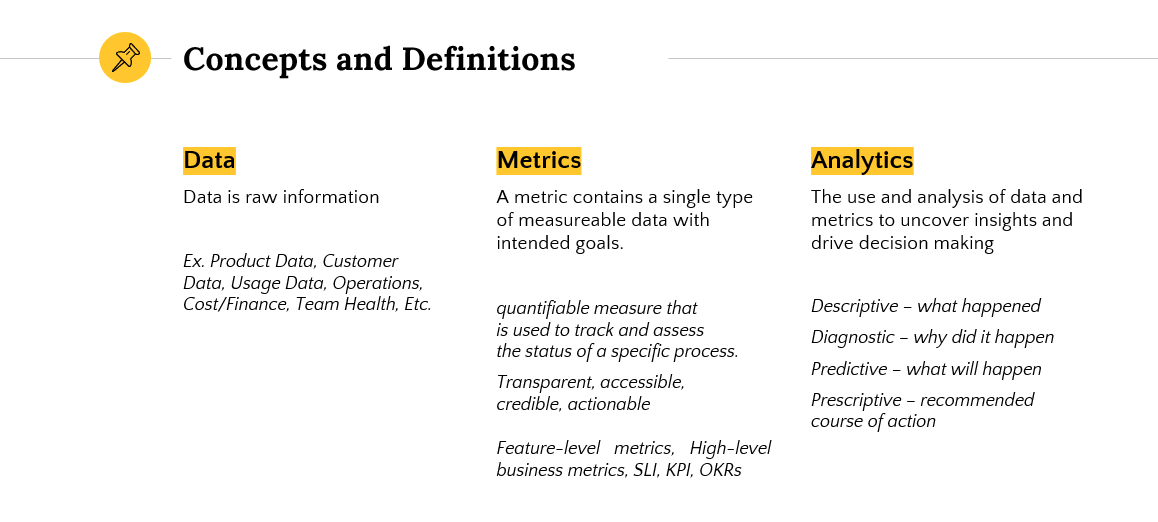
Autodesk’s Cloud Platform (Forge) has several applications and services. Understanding how our customers work, how they use the applications or features is accomplished by using analytics — instrumenting the applications and services to collect data so that we can generate reports, slicing and dicing the data in different dimensions to gain important insights into user behavior.
This data allows us to develop applications and services better, to create and validate product changes and assumptions, to understand patterns, and to make decisions regarding future product changes or improvements. This is critical for several operations, like monetization, where we need to report customer usage of specific APIs for business reasons.
As Forge matures as an organization, we will be building a business and a platform based on Forge. As a business, we must be ready to be able to measure our performance — having to develop the instrumentation to do so reactively would be disastrous. This research focuses on what exactly we need to do as an organization in order to provide proper metrics, analytics, and insights for the products, services, and customers using our platform.
For this project, I was the lead researcher on a team of five – with 2 product managers, 1 designer, and 1 other researcher. I was responsible for creating the moderator guides for interviews, conducting interviews, taking notes, performing secondary research, analyzing transcripts, extracting job stories, performing synthesis, and presenting our results to stakeholders, along with the rest of the team.
PROJECT DETAILS
ROLE: LEAD RESEARCHER
PROJECT TYPE: FOUNDATIONAL RESEARCH
TEAM MEMBERS: 5
DURATION: 4 MONTHS
Problem
Forge has several different systems we support. Each of these systems have different levels of analytics, if they have them at all. As it stands now, our Product Manager, Marketing, and Development teams are not able to gain customer insights or to validate assumptions. Regardless of whether or not these are public-facing services, each team needs to instrument their services as if they were. We needed to align all of our internal and external systems so that we can easily compare ‘apples to apples’ across all of our products and services.
Hypotheses
In order to arrive at a solution, we believe we needed to understand the analytics needs of our organization. From senior leadership through every individual contributor, different individuals need different levels of analytics, at differing levels of fidelity, tracking a wide variety of different metrics. By understanding these needs, we would then be able to develop a coherent, prioritized roadmap and recommendations for how to organize our analytics.
Methods & Process
As with most foundational research, we started by understanding the problem space by conducting interviews and performing secondary research by looking at how other organizations structured their analytics practices, what kinds of metrics and data we needed to pay particular attention to, etc. By analyzing and synthesizing this qualitative data, we moved towards defining several ‘meta’ personas or categories of analytics users. This allowed us to prioritize different use cases and develop a roadmap towards analytics excellence, with recommendations on how to get there.
- Explore existing research and literature about analytics organizations
- Interview key stakeholders across our organization to gain a baseline understanding of their analytics needs
- Analyze the interview data, grouping common statements and attitude
- Synthesize the data into meta groupings the typify different personas of analytics users
- Prioritize the persona groupings to inform the project roadmap
- Construct a set of recommendations to achieve analytics excellence with the organization
- Deliver a report detailing our process, findings, and recommendations to key stakeholders
Understanding
Due the wide scope of the project, needing to define an analytics strategy for a 600 person organization, we conducted a total of 32 hour-long interviews, with stakeholders in many different roles across the company, from our SVP on down.
In each of these interviews, we asked questions like:
- What are the key analytics insights you use related to your business/product/team in order to drive important outcomes?
- Why are these insights important as opposed to others?
- How do these insights impact business outcomes?
- When do you need these insights?
- How do you get the data you need?
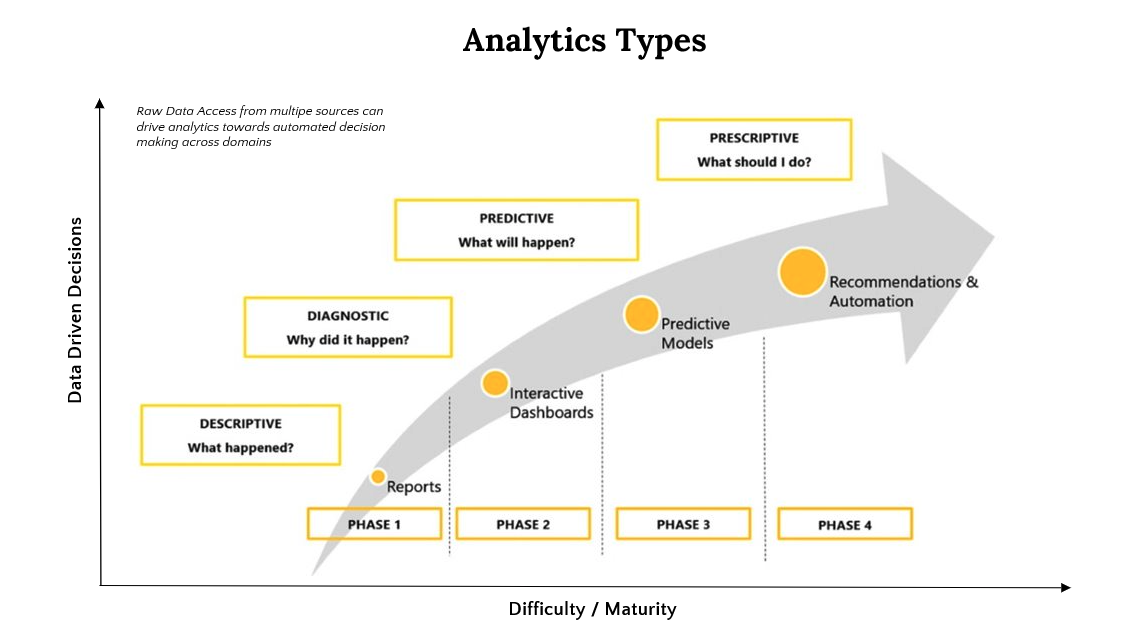
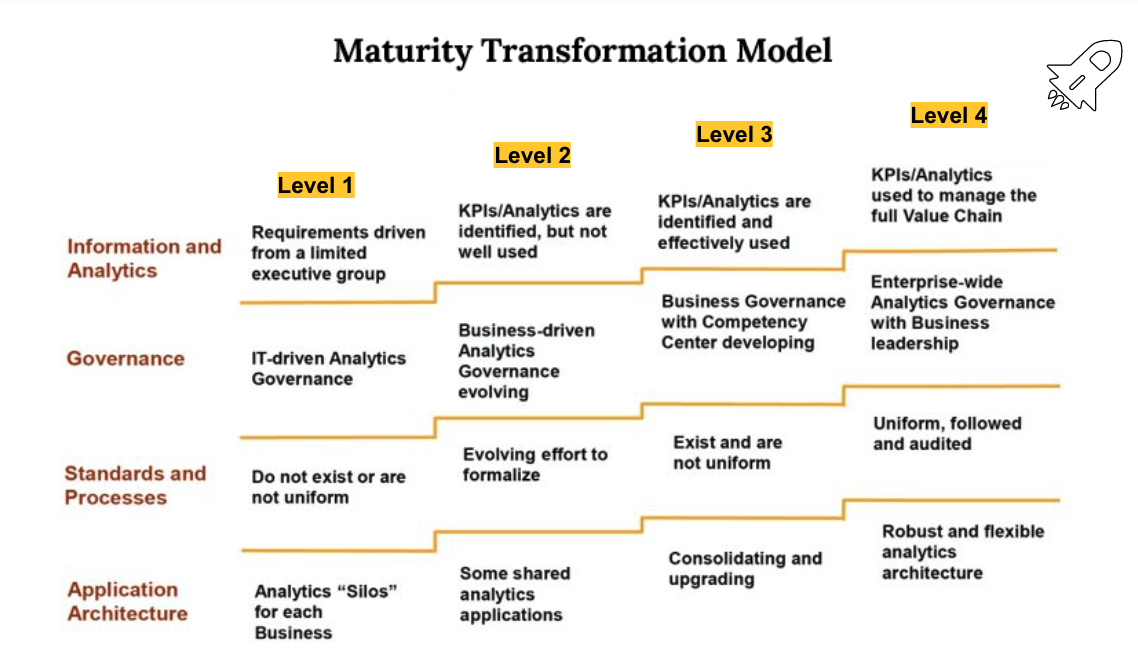
We also asked about what an ‘ideal’ analytics solution might look like from their point of view, in order to give us some features to investigate and usability guidelines to shoot for. We paired this with secondary research concerning analytics to create a roadmap of analytics ‘maturity’ for our organization, which helped us better describe where we were now and what things would look like several years down the road.
The interviews and secondary research provided us with a solid collection of quotes, use cases, and needs statements from which to begin our analysis.
Refining
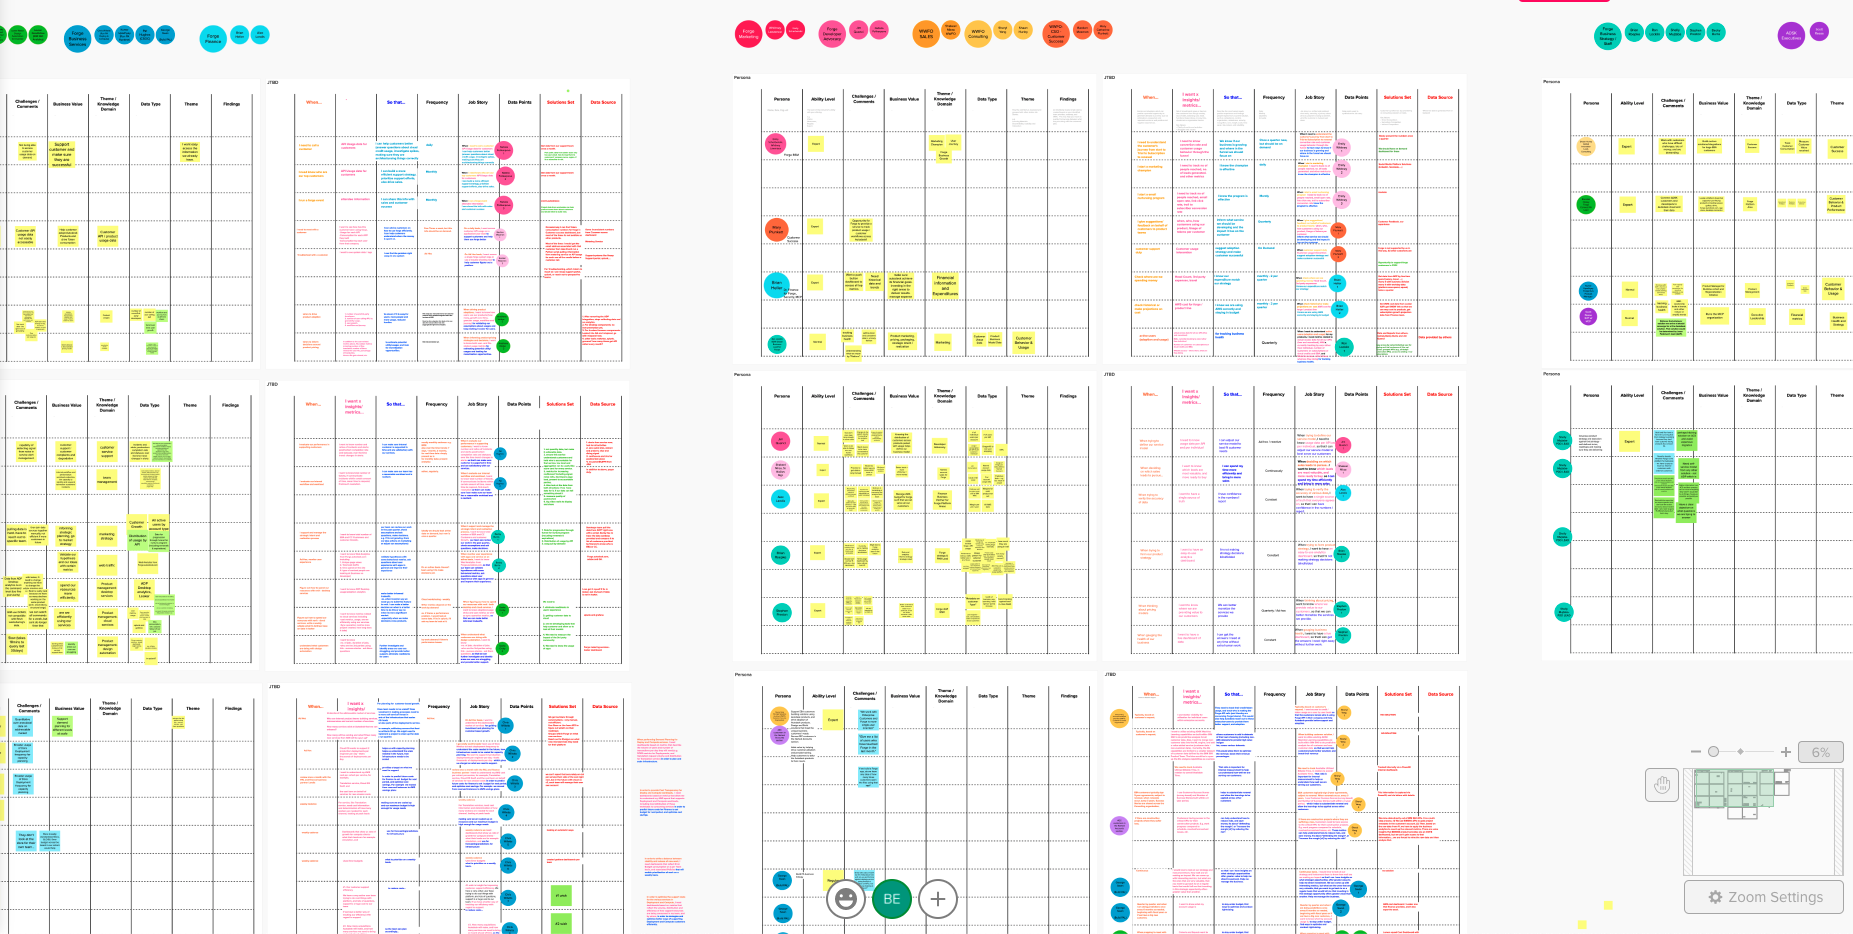
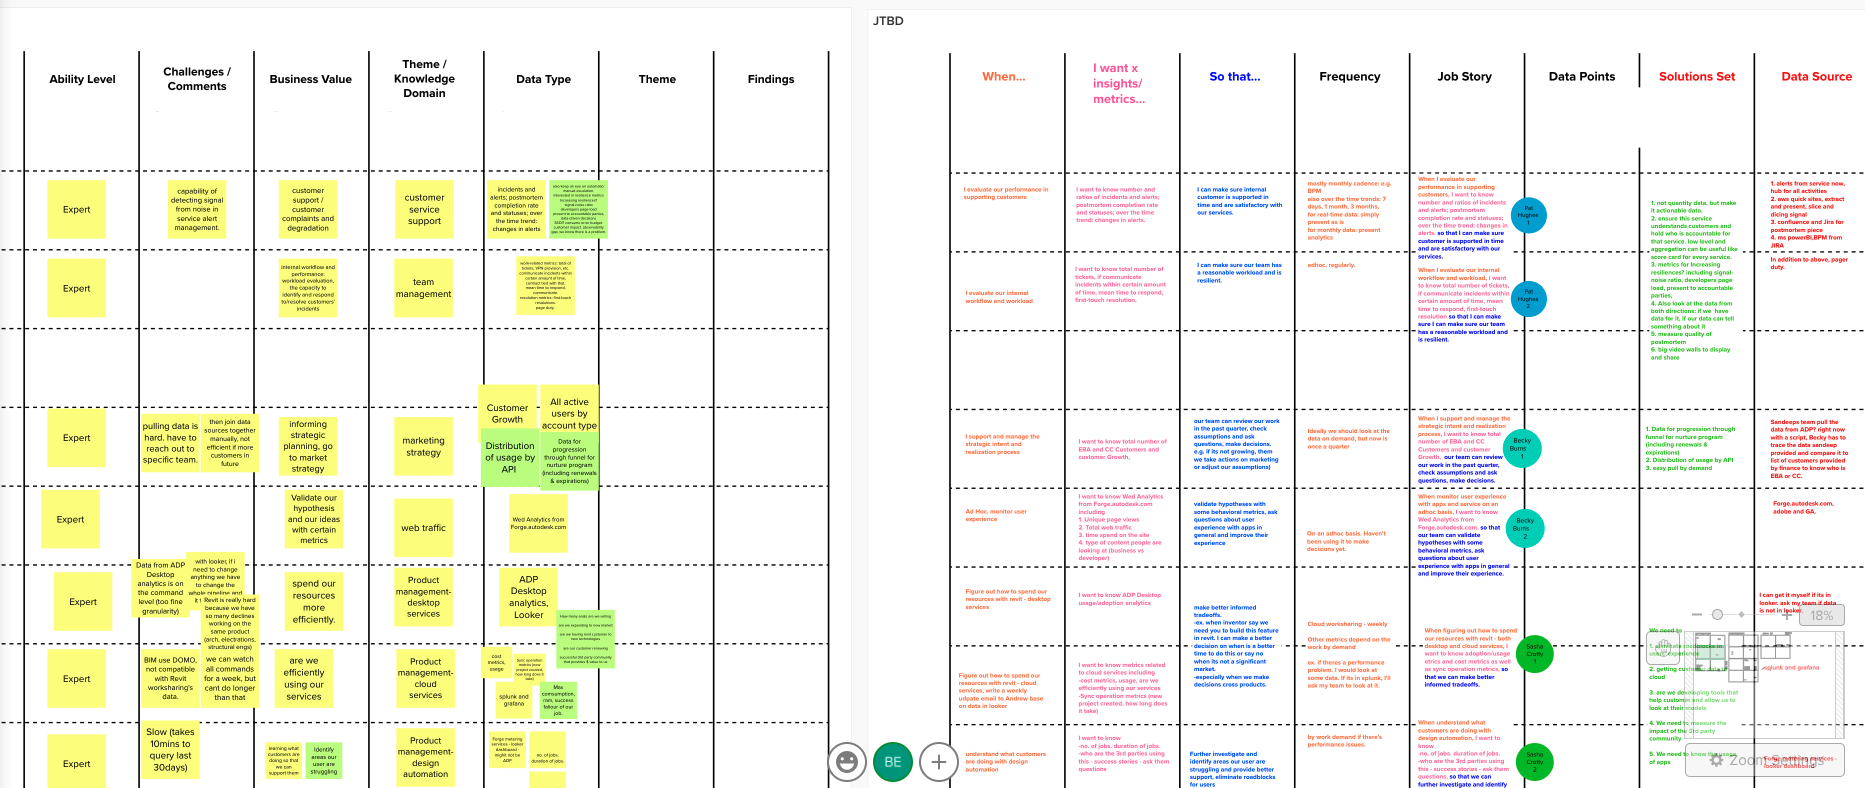
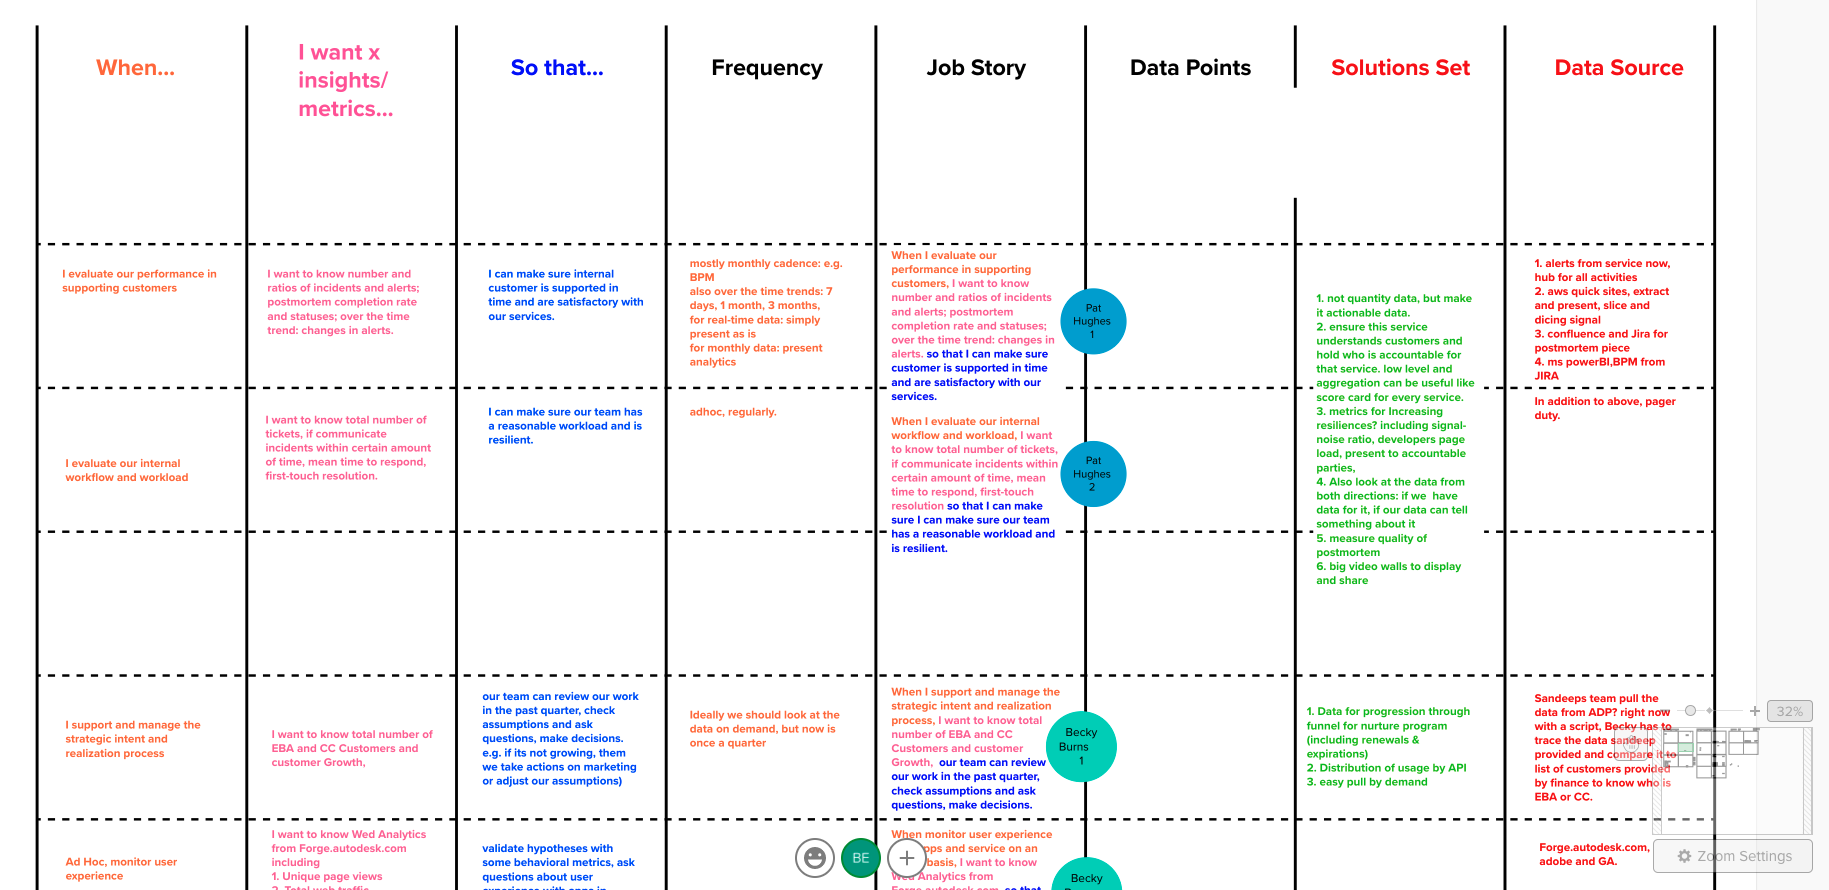
We took the interview data and started breaking it up by the user’s role / division within the company and looked for the key needs statements from that user, using the Jobs To Be Done (JTBD) framework. We wrote job stories, captured quotes, kept track of related metrics and data sources and ended up with a wealth of insights about how analytics was currently being done at Autodesk.
Using the initial grouping we did by role / division, we noticed a flow of analytics information between groups. We wanted to understand these relationships between organizations better, so we made a rough concept map:
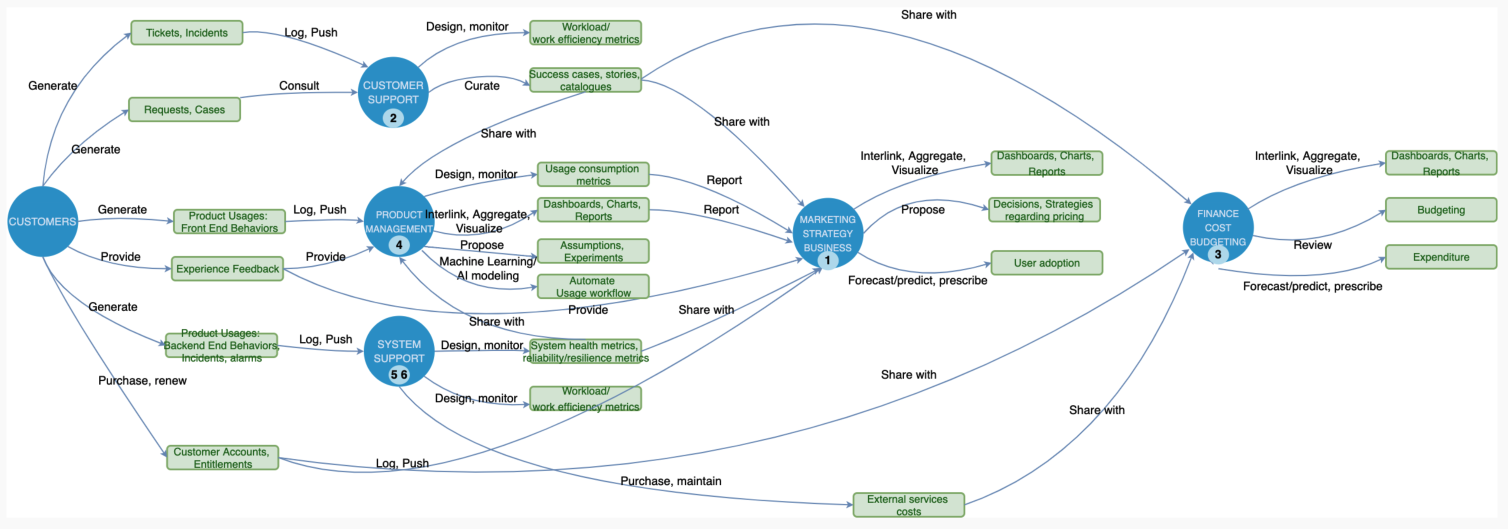
What emerged from the concept map were the distinct ‘meta-personas’ representing a group of users with similar Jobs To Be Done, whose relationships in consuming and producing different analytics artifacts could be understood in relation to the rest of the organization.
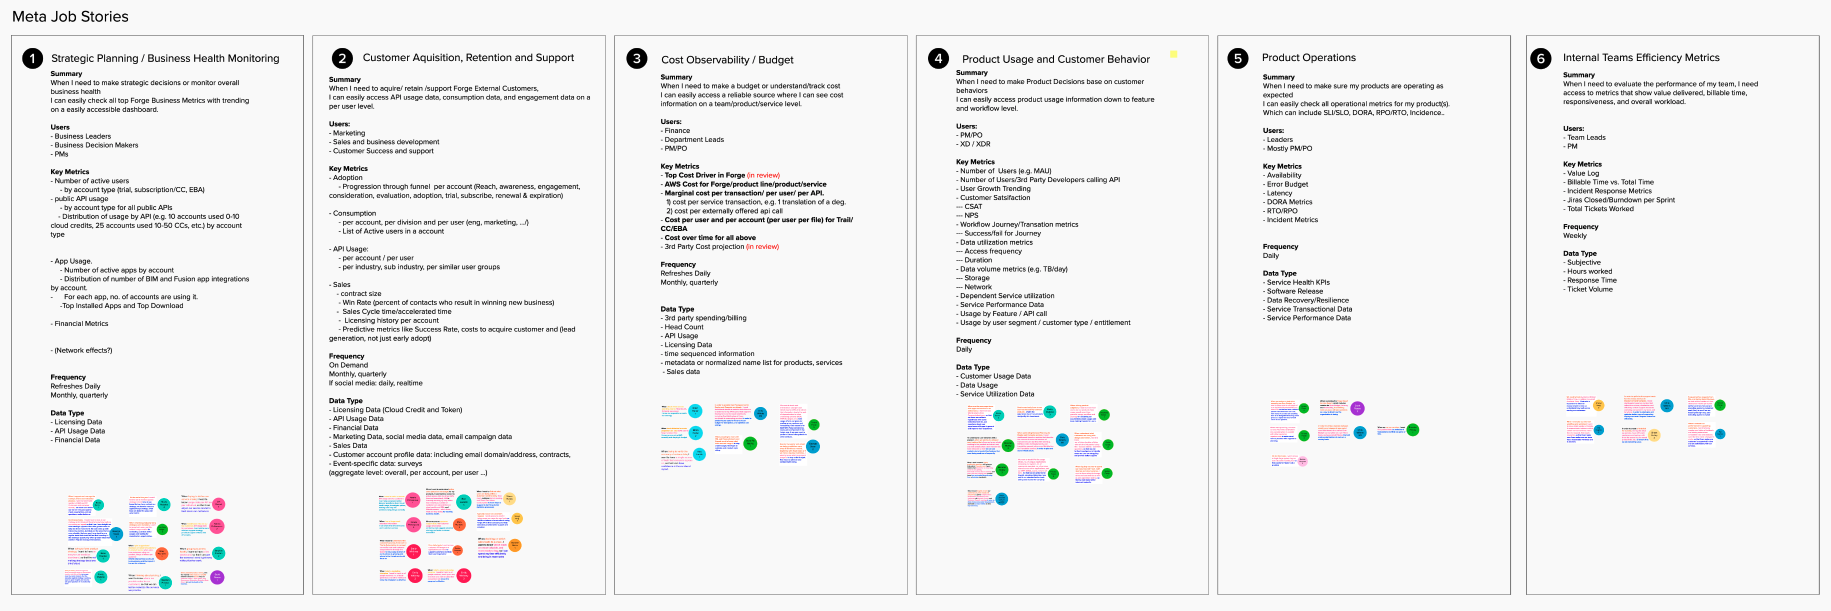
This led to us being able to define six ‘meta job stories’ representing the different types of analytics usage across the company:
- Business Health Monitoring & Strategic Planning
- Customer Acquisition & Support
- Cost Management and Resource Planning
- Product Development
- Product Operations
- Internal Team Efficiency
We were then able to categorize the job stories according to these personas, which allowed us to flesh out the users, specific analytics needs, key metrics, and data types for each persona.
Delivering
With our six meta job stories and associated information, we were able to look at the different stories with an eye towards creating a roadmap. Since each of our six meta stories related to certain kinds of analytics data, we asked ourselves and our stakeholders which ones were most urgent — they told us (in no uncertain terms) that the data and metrics related to strategic planning and business health monitoring were the most critical.
This included key metrics about the health of our cloud platform, such as:
- Number of unique applications that have made at least 1 API call (day/month)
- Top 10 unique applications by number of API requests
- Number of calls per API end point
- Request success rate
- Average request time
Our next step was to deliver recommendations and roadmap on how to get there.
Findings & Results
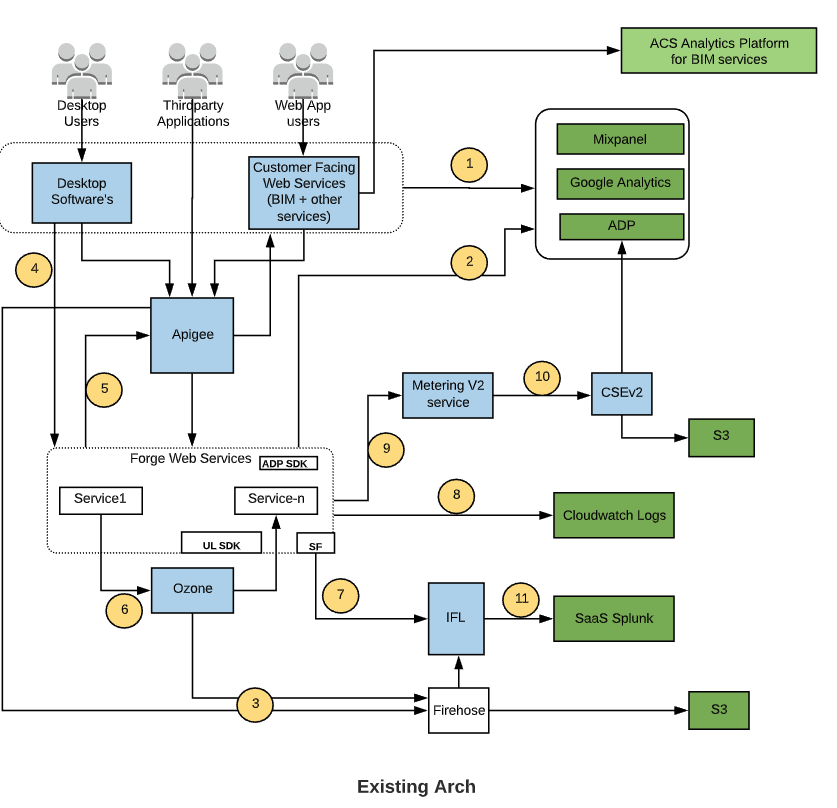
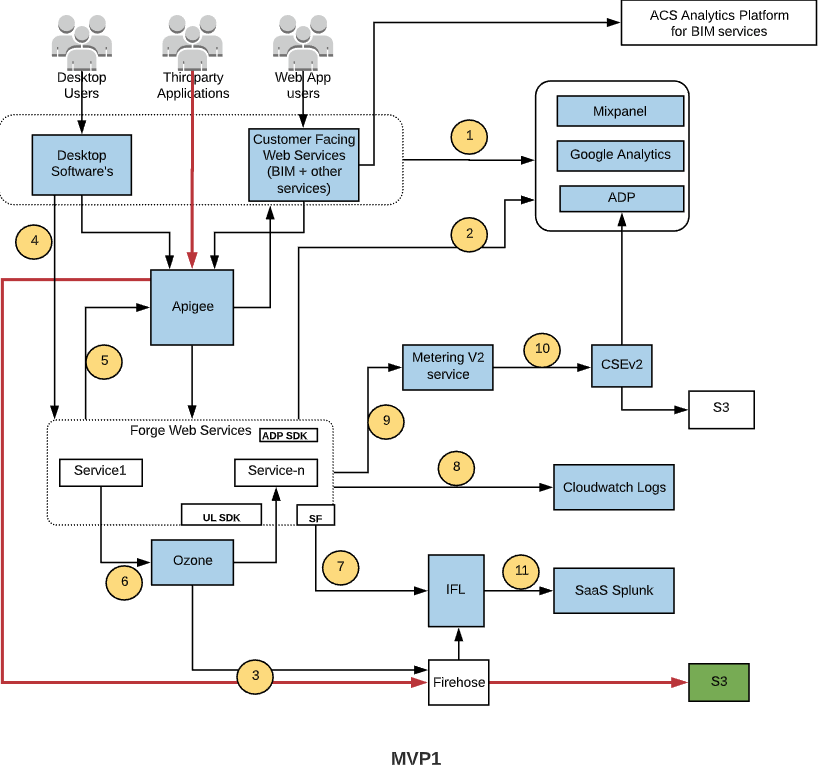
Based on our analytics maturity model (see below), we needed to collaborate with engineering leads to architect how we would get from our current, siloed system, to at least a minimum viable product for our first use case (business strategy analytics).
Given what we knew about the jobs that needed to be done with this set of analytics, we were able to trace back where all those pieces of information lived, and work with engineering to create a map of how a more unified data flow might be constructed, stage by stage, and what kind of resources we might need to make it happen.
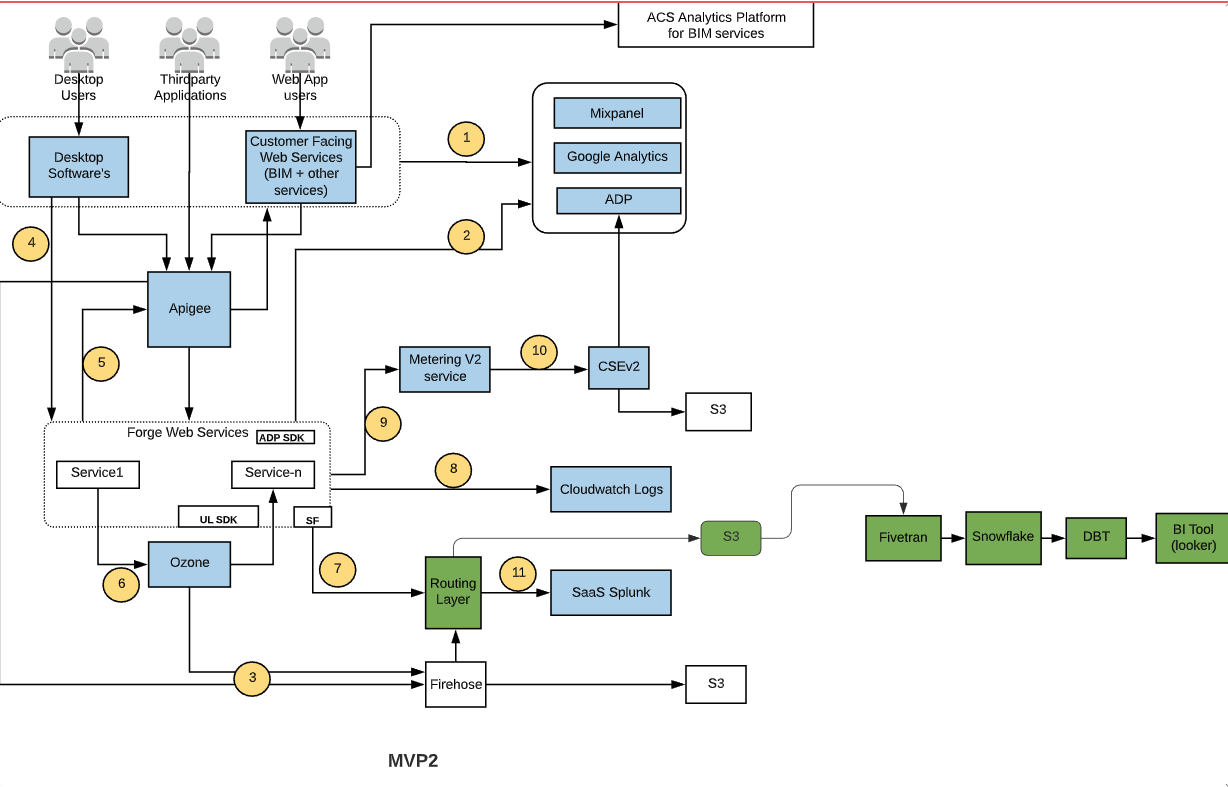
We were then able to propose to leadership the creation of a engineering team to be responsible for building out this new streamlined infrastructure and delivering the associated data and metrics that our interviews had uncovered as necessary.
This was approved by leadership, the team was created, and the first version of the ‘Forge Business Analytics Dashboard’ was recently released (April 2021), with a planned iteration coming in July 2021.